 IUX
IUX
 Exness
 Vantage
 XM
XM
 ICMarkets
 LiteFinance
 Moneta
 Tickmill
 South Africa (9)
 India (9)
 Bangladesh (12)
 Germany (9)
 Thailand (10)
 Philippines (9)
 Nigeria (10)
 Vietnam (10)
 Malaysia (9)


10 Best Trading Indicators for Accurate Market Analysis


Share:
Share:
Education
7 min read
In Forex, trading indicators are tools traders use to understand market movements better. So, this raises the question:
What is the best trading indicator?
Well, it depends on what kind of Forex trading you want to involve yourself in. These technical indicators help you in different types of Forex trading, like swing trading and such. It also helps you in better risk management.
To find the best trading indicator for yourself, stick with it till the end, and learn about the top ten best trading indicators for Forex trading.
Each trading indicator works differently, and they have distinctive actions, meaning you have to know how they work to leverage them for your Forex trading.
Here are the trading indicators:
EMAs
EMAs, or exponential moving averages, are the complex version of moving averages. EMA calculations focus more on recent actions than on providing a straight average price. So, it makes them less lagging than moving averages.
So, you can use EMA crosses to get signals from a long-term and a short-term average. Also, when a market trades above its EMA, it’s bullish.
On the contrary, it’s a bearish sign when it’s below the market. Lastly, EMAs also act as resistance or support levels.
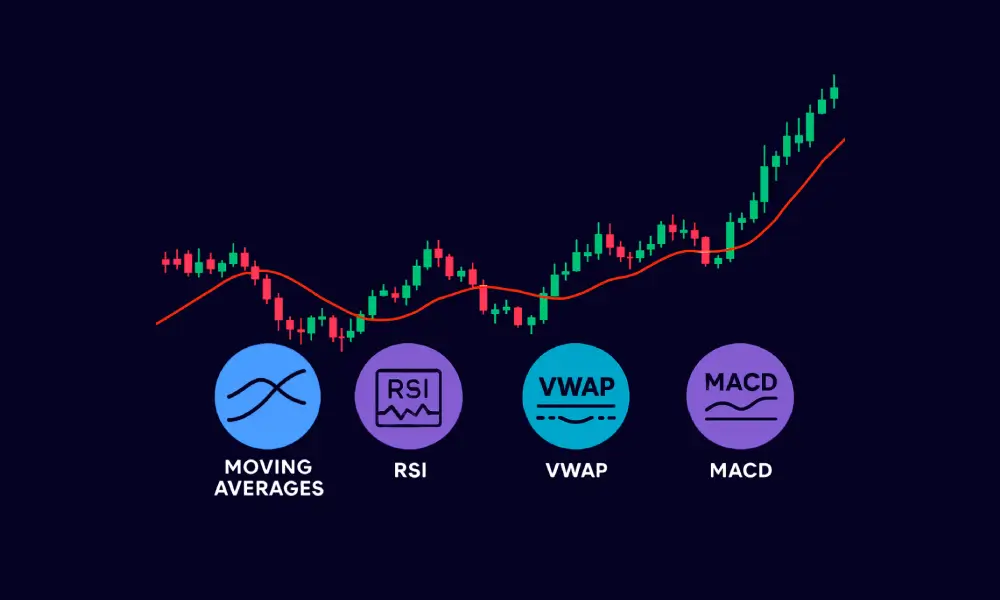
Moving Averages
Moving Averages, or MAs, are the simplest trading indicators in Forex. This indicator shows the market price over a few sessions and gives you the average.
Therefore, the tool will take the new action when the market moves and update you accordingly.
So, the primary use of this technical indicator is to smooth out short-term volatility and identify the broader market trend.
As for scalability, it depends on you: the more sessions you include in the calculation, the more refined your MA will be.
onversely, you can use MAs to create signals. Additionally, a standard method is to add the two averages of a chart: one short-term and one long-term.
With this intention, if the short-term MA exceeds the long-term, you can consider it a selling opportunity. Meanwhile, if it’s vice versa, then it’s a buying opportunity.
MACD
MACD, or Moving Average Convergence Divergence is a trading indicator that uses price data to provide better insight into the market. Unlike EMA and MA, it appears below the market chart, meaning it’s an oscillator.
These are then overlaid into the actions.
MACD is calculated using the difference between two EMAs It is plotted as a line, with a second line called the signal line (a 9-period EMA of the MACD) for trade signals.
RSI
As mentioned earlier about the oscillator, RSI is also an oscillator. However, you have to use RSI to identify oversold and overbought conditions.
To elaborate, RSI measures the market gains made in your sessions where it stopped and compares them to the losses during the closure.;
Afterwards, the indicator calculates a reading of 1 to 100. So, a reading of 70 or above means the market is overbought, and a reading of 30 or below means it’s oversold.
Stochastic Oscillator
RSI is always a topic of comparison with the stochastic oscillator. Even though they work differently, both indicators measure momentum.
So, the stochastic oscillator compares the market's recent close to its previous lows and highs.
Additionally, it informs you where it currently stands within the specified range. Similarly to the RSI, it drafts information in a reading of 1 to 100 in a line. Yet, the stochastic includes a signal line. It’s the moving average of the primary line.
Unlike RSI, the reading is different, so a reading above 80 means the markets are overbought, and a reading below 20 means it's oversold.
Bollinger Bands
Bollinger Bands are the most prominent trading indicators in Forex Trading. If you use them, you will notice that they are very similar to MAs because they display as a series of lines on the chart.
However, the main difference is that they show market volatility rather than average price movements.
They function by using an MA with two lines on either side, and each of the two lines includes standard deviations below or above the MA.
Pivot Points
Pivot Points identify future resistance and support levels to play in the Forex market. They calculate and overlay the price data from earlier sessions onto the market chart.
So, when you choose this indicator, you will see several horizontal lines on your market chart.
The middle line is denoted P, with S1, S2, S3, S4, and S5 below it and R1, R2, R3, R4 and R5 above it.
Fibonacci Retracement
Similar to the Pivot Points, you can use the Fibonacci Retracement to identify upcoming resistance or support levels based on the momentum reversal.
However, instead of using the earlier sessions, the indicator calculates it by focusing on a drastic move down or up.
Moreover, the indicator takes ratios from the prominent Fibonacci theory. Then, it applies them to a later significant move.
The primary intention is that the retracement of the move will reverse at a level that makes it worthwhile for close or open positions
ATR
ATR informs you of market movement during the current session.
Basically, it works out the market’s true range based on the highest value between the Current high and the previous close, the lowest value between the Current low and the previous close, and the Current high and Current low calculations.
These calculations are based on the moving average over a series of sessions. If your ATR is increasing, then it’s safe to assume that the market is volatile.
Meanwhile, if it falls, then the market is stabilizing.
Lastly, there is ADX. It’s a trading indicator that measures the power of ongoing trends in the Forex market. ADX plots the MA that pops up beneath the market’s chart. Yet, for ADX.
It’s the average price expansion, and it tells you whether the range is decreasing or increasing.
As previously mentioned about the two momentum indicators, Stochastic or RSI, ADX does not create oversold or overbought signals.
Instead, if the reading is above 25, you can assume it’s a strong trend. However, if the reading is below 25, it’s a weak trend.
Each trading indicator has its distinctive advantage, and for option trading, MACD, EMA, and Bollinger Bands are the most accurate on.
ADX
Lastly, there is ADX. It’s a trading indicator that measures the power of ongoing trends in the Forex market. ADX plots the MA that pops up beneath the market’s chart. Yet, for ADX.
It’s the average price expansion, and it tells you whether the range is decreasing or increasing.
As previously mentioned about the two momentum indicators, Stochastic or RSI, ADX does not create oversold or overbought signals. Instead, if the reading is above 25, you can assume it’s a strong trend. However, if the reading is below 25, it’s a weak trend.
Final Notes
In conclusion, trading indicators change your Forex trading trajectory and give you an advantage. However, you must use them wisely and, most importantly, know when and where to use them. You can use any of the best trading indicators we suggested and implement them in your Forex trading.
Lastly, TopAsiaFX will help you in this journey by providing you with the best information regarding the aspects of Forex Trading.
FAQs
What is the Most Accurate Trading Indicator?
MACD, RSI, and Moving Averages are among the most reliable trading indicators. However, remember that trading indicators are never 100% accurate.
Which Indicator is 100% Accurate?
Trading indicators only show you the probability, meaning it’s never 100% accurate. The Forex market is very dynamic, and till now, there is no trading indicator that has 100% accuracy.
What is the Most Accurate Indicator for Option Trading?
Each trading indicator has its distinctive advantage, and for option trading, MACD, EMA, and Bollinger Bands are the most accurate ones.
F. Nathan
Felix Nathan is a professional trader, market analyst, and business development executive with over a decade of experience in the forex and financial markets. Felix specializes in providing actionable market insights, trading strategies, and risk man...