 IUX
IUX
 Exness
 Vantage
 XM
XM
 ICMarkets
 LiteFinance
 Moneta
 Tickmill
 South Africa (9)
 India (9)
 Bangladesh (12)
 Germany (9)
 Thailand (10)
 Philippines (9)
 Nigeria (10)
 Vietnam (10)
 Malaysia (9)


What Are the Best Timeframes for Swing Trading in Forex?


Share:
Share:
Strategy
5 min read
For forex swing traders, the daily chart (D1) is the go-to. It filters out intraday noise, shows cleaner price action, and gives you time to make decisions without being glued to your screen.
Use the weekly chart (W1) to spot the bigger trend direction and key support/resistance zones.
Then drop to the 4-hour chart (H4) to fine-tune your entries and exits.
This combo of weekly, daily, and 4-hour gives you a multi-timeframe view that keeps you trading with the trend while catching precise entry points. Most swing trades last anywhere from 2 days to a few weeks.
Timeframes Matter More Than You Might Think in Swing Trading. Here’s Why
Swing trading is not about obsessing over every little tick on the screen. You’re not trying to catch tiny price moves that happen in minutes; that is day trader territory.
As a swing trader, you’re playing the mid-game. You’re taking advantage of those market movements that stretch over a few days to maybe two or three weeks. And because of that, the timeframe you choose is everything.
Your charts should help you:
- Spot the overall trend without getting distracted by noise
- Find clean entry and exit points based on clear setups
- Stay sane (because staring at the 5-minute chart all day will melt your brain)
Most swing traders live on the 4-hour (H4) and daily (D1) charts. These timeframes give you a wide enough view to understand the market’s direction, but still offer enough details to help you time your trades smartly.
Daily charts help you spot the bigger picture, like major trends, strong support/resistance zones, and critical price levels.
Meanwhile, 4-hour charts zoom in just enough so you can plan your entries, stops, and targets with more precision.
You can even do a top-down approach:
- Start with the daily chart to understand the trend.
- Drop down to the 4H for a cleaner entry.
- Peek at the 1H chart if you want to get extra precise but don’t live there (This is optional).
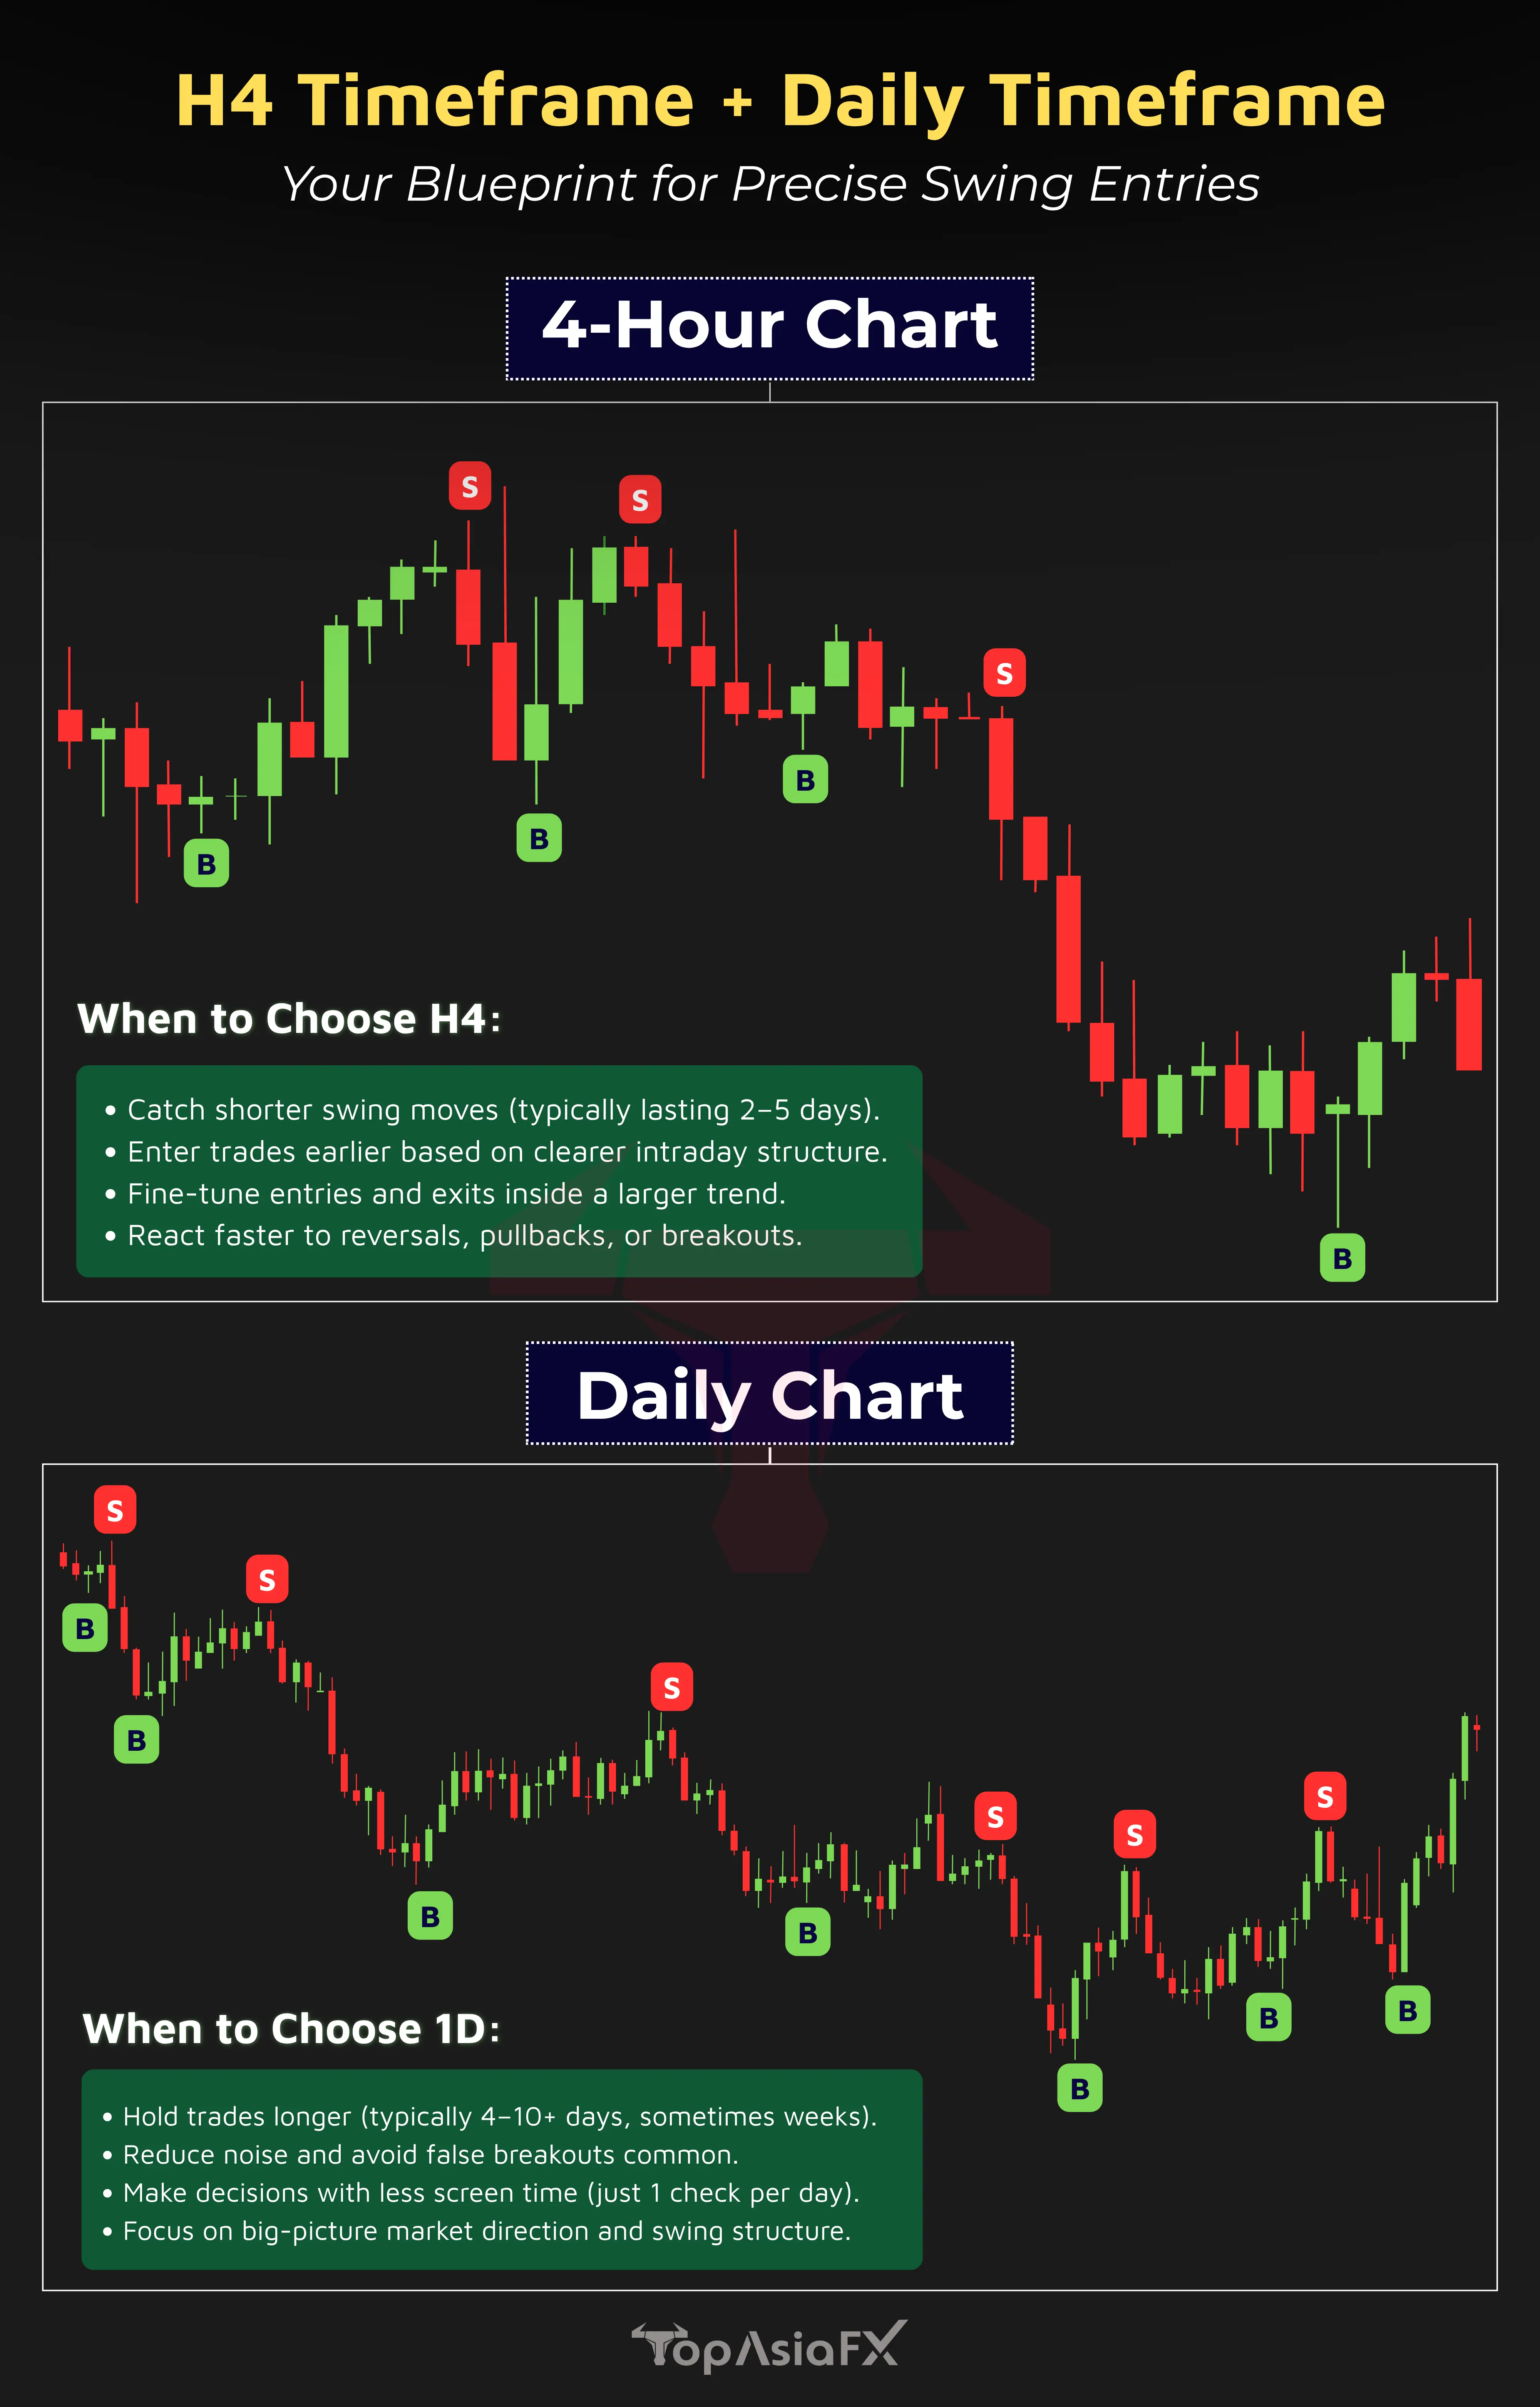
H4 and Daily Charts, the Power Combo
Each of these charts plays a different role, but together, they help you plan smarter trades without getting lost in the noise.
Before exploring the details of H4 and Daily charts, take a look at the infographic for a quick overview. It will give you a clear snapshot of how to approach swing trading and plan your trades effectively.
Here’s a look at them in-depth:
The 4-Hour Chart (H4)
Think of the 4-hour chart as a battlefield map. It zooms in just enough to help you time your entries with precision, without overwhelming you like those 15-minute charts.
- Use Case: The H4 chart is best for fine-tuning when to get in and where to place stops.
- Why It’s So Great: Swing traders love this chart because it moves fast enough to catch breakouts or retests, but not so fast that they have to stay glued to their screen.
Here’s a quick example:
You spot a bullish setup on the daily. Instead of jumping in blindly, you switch to the H4 and wait for a clean retest or a bullish candlestick (like an engulfing pattern).
The Daily Chart
This is ideally your command center. The daily chart helps you see the trend, understand the market mood, and avoid silly mistakes like trading against the flow.
- Use Case: It works best for spotting the overall direction of the market and strong chart patterns.
- Why We Love It: With the daily chart, there’s less noise, more clarity, and way fewer fake-outs than smaller timeframes.
For instance, you see a perfect ascending triangle forming on the daily chart. Instead of jumping in too early, you track it on the H4 to catch the breakout with better timing.
You Can Also Try This Multi Timeframe Swing Trading Strategy
If you’re only trading from one timeframe, you’re kind of flying with one eye closed.
Swing traders who win consistently zoom in and out. That is where multiple timeframe analysis comes in, your secret weapon for clearer, smarter trades.
This multi timeframe trading is called top down analysis and this is how it works.
The Weekly Chart is your big-picture view. It shows you the major zones, such as the strong support and resistance, trendlines, and overall market sentiment. Think of it as the “climate” you’re trading in.
On the other hand, the Daily Chart serves as a confirmation chart, more or less. This is where you check if price action aligns with what you saw on the weekly. Is the trend continuing? Are you seeing bullish or bearish signals? Check your daily chart.
The H4 Chart is your action station. This is where you find your entry, stop loss, and profit target. You’re looking for precise setups, like breakouts, candlestick patterns, retests, and indicator confirmations here.
For instance, Let’s say you’re eyeing a trade on EUR/USD. Here’s how you’d layer your analysis:
- Weekly Chart: You notice price is bouncing off a major support zone that’s held for months. That’s your first green flag.
- Daily Chart: You see a strong bullish engulfing candle right at that support zone. This means that the momentum might be shifting upward.
- H4 Chart: If the RSI shows a bullish divergence and the price just broke above a short-term resistance line, this is your entry trigger.
Now, instead of trading on a hunch, you’ve stacked the odds in your favor with solid confirmation from three different perspectives.
What is the Best Timeframe for You?
There’s no single “best” timeframe for all Forex swing traders.
But this is a battle-tested combo that works for most: Use the daily chart for direction, H4 for entries, and the weekly chart for confirmation.
This three-layered approach will help you avoid bad trades, stay with the trend, and stop over-trading.
F. Nathan
Felix Nathan is a professional trader, market analyst, and business development executive with over a decade of experience in the forex and financial markets. Felix specializes in providing actionable market insights, trading strategies, and risk man...