 IUX
IUX
 Exness
 Vantage
 XM
XM
 ICMarkets
 LiteFinance
 Moneta
 Tickmill
 South Africa (9)
 India (9)
 Bangladesh (12)
 Germany (9)
 Thailand (10)
 Philippines (9)
 Nigeria (10)
 Vietnam (10)
 Malaysia (9)


What Are the Key Principles of Successful Swing Trading?


Share:
Share:
Strategy
8 min read
Successful swing trading comes down to a handful of core principles that separate consistent traders from gamblers. It starts with risk management: limiting exposure to 1-2% of your account per trade and always using stop-loss orders to protect capital.
Swing traders rely on technical analysis to identify trends, support and resistance levels, and high-probability entry and exit points on daily or 4-hour charts. Patience is critical because the best setups require waiting days or weeks to develop.
Maintaining at least a 2:1 reward-to-risk ratio ensures that even with a modest win rate, profits outpace losses over time.
Discipline and a clear trading plan tie it all together.
Spot the Trend
Your first job is to spot the trend. Use simple tools like moving averages, trendlines, or even just good ol’ price action.
Are prices consistently making higher highs and higher lows? That’s a classic uptrend. Lower highs and lower lows? You’re in a downtrend. Either way, the goal is to look for that trend and recognize what you see.
Want to know my favorite way to go with this?
Slap the 20-day and 50-day EMAs on your chart. If the 20-day EMA is above the 50 and both are sloping upward, then the momentum is in your favor. If the price is bouncing off those EMAs like a trampoline? Even better.
Use Support and Resistance (Your Built-in GPS)
Support and resistance levels are like the borders of a football field.
When the price nears a key support, buyers might step in. At resistance, sellers show up. Being able to identify these zones helps you enter and exit with clean precision.
How to Spot Support and Resistance Levels?
- Look for multiple tests. A level that’s been hit and bounced off three or four times is stronger than one you’ve only seen once. The more “touches,” the more traders trust that zone.
- Use round numbers and swing extremes. Whole-number prices (e.g., 1.2000 or 1.1500 in EUR/USD) often act as psychological S&R. Likewise, previous swing highs and lows on higher timeframes (daily/4-hour) carry weight.
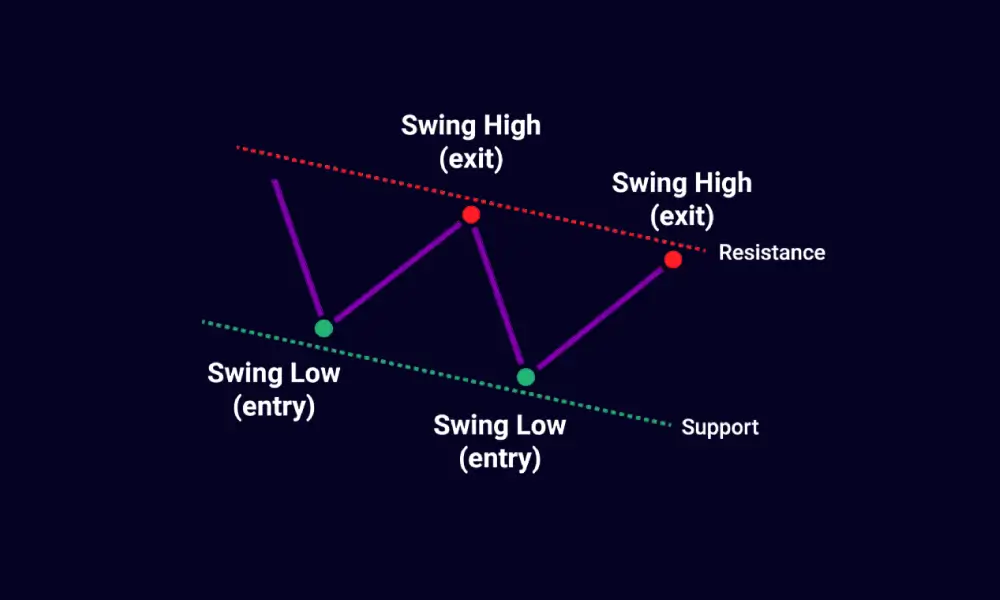
- Draw trendlines and channels. An uptrend line connecting consecutive higher lows is a dynamic support. Alternatively, a descending trendline across lower highs acts as dynamic resistance. Channels give you parallel borders to watch for bounces.
- Zoom out for the big picture. Zones that look minor on a 15-minute chart might be huge on the 4-hour or daily chart. Always cross-check multiple timeframes to identify “major” S&R versus “minor” ones.
You’ve marked your support and resistance, now what? Patience, dear friend.
You need to learn to wait for these green lights:
- Candlestick Confirmation: At a support area, watch for bullish patterns, like a pin bar or bullish engulfing candle, before jumping in. At resistance, look for bearish signals. If the price just “kisses” the zone and leaves without a clear rejection, that’s a red flag.
- Volume or Momentum Clues: Sometimes, price can hover at S&R but lack conviction. If a bounce off support comes with rising volume or positive momentum (say RSI turning up), that’s your cue. Also, a fading rally into resistance on declining volume suggests sellers are gearing up.
- Retest Tactics: A breakout through resistance can flip that same level into support on the next pullback. Waiting for this retest, where price revisits the broken resistance, gives you a cleaner entry with reduced risk. The same applies in reverse when support breaks and becomes resistance.
For instance, imagine EUR/USD has been stuck between 1.1000 (support) and 1.1100 (resistance) on the 4-hour chart. Price drops back to 1.1000 and forms a hammer candle with a long lower wick, buyers just stomped in.
Combined with a bullish RSI divergence, that’s your signal to buy, with a tight stop just below 1.1000. If the price then rockets up toward 1.1100, you either take profit there or trail your stop as the price carves new highs.
Use Swing Trading’s Secret Weapon: Chart Patterns
Bull flags. Cup and handle. Head and shoulders.
No, we’re not naming cocktails. These are chart patterns. And if you don’t learn to read these shapes, you’re simply trading with the lights off.
Chart patterns are the market’s way of dropping hints about what’s coming next. They show up in the price action, with no fancy indicators needed, and can signal whether the trend’s about to continue, pause, or reverse.
For swing traders looking to time their entries and exits with sniper-like precision, this is gold.
Think of chart patterns as the body language of the market. They don’t speak in words, but if you learn the signs, you’ll know exactly when to step in and when to stay out.
They can show you when momentum is building up for a breakout, when a trend is losing steam, and where a pullback might end and a swing might begin.
Popular Chart Patterns Every Swing Trader Should Know
Bull Flag / Bear Flag
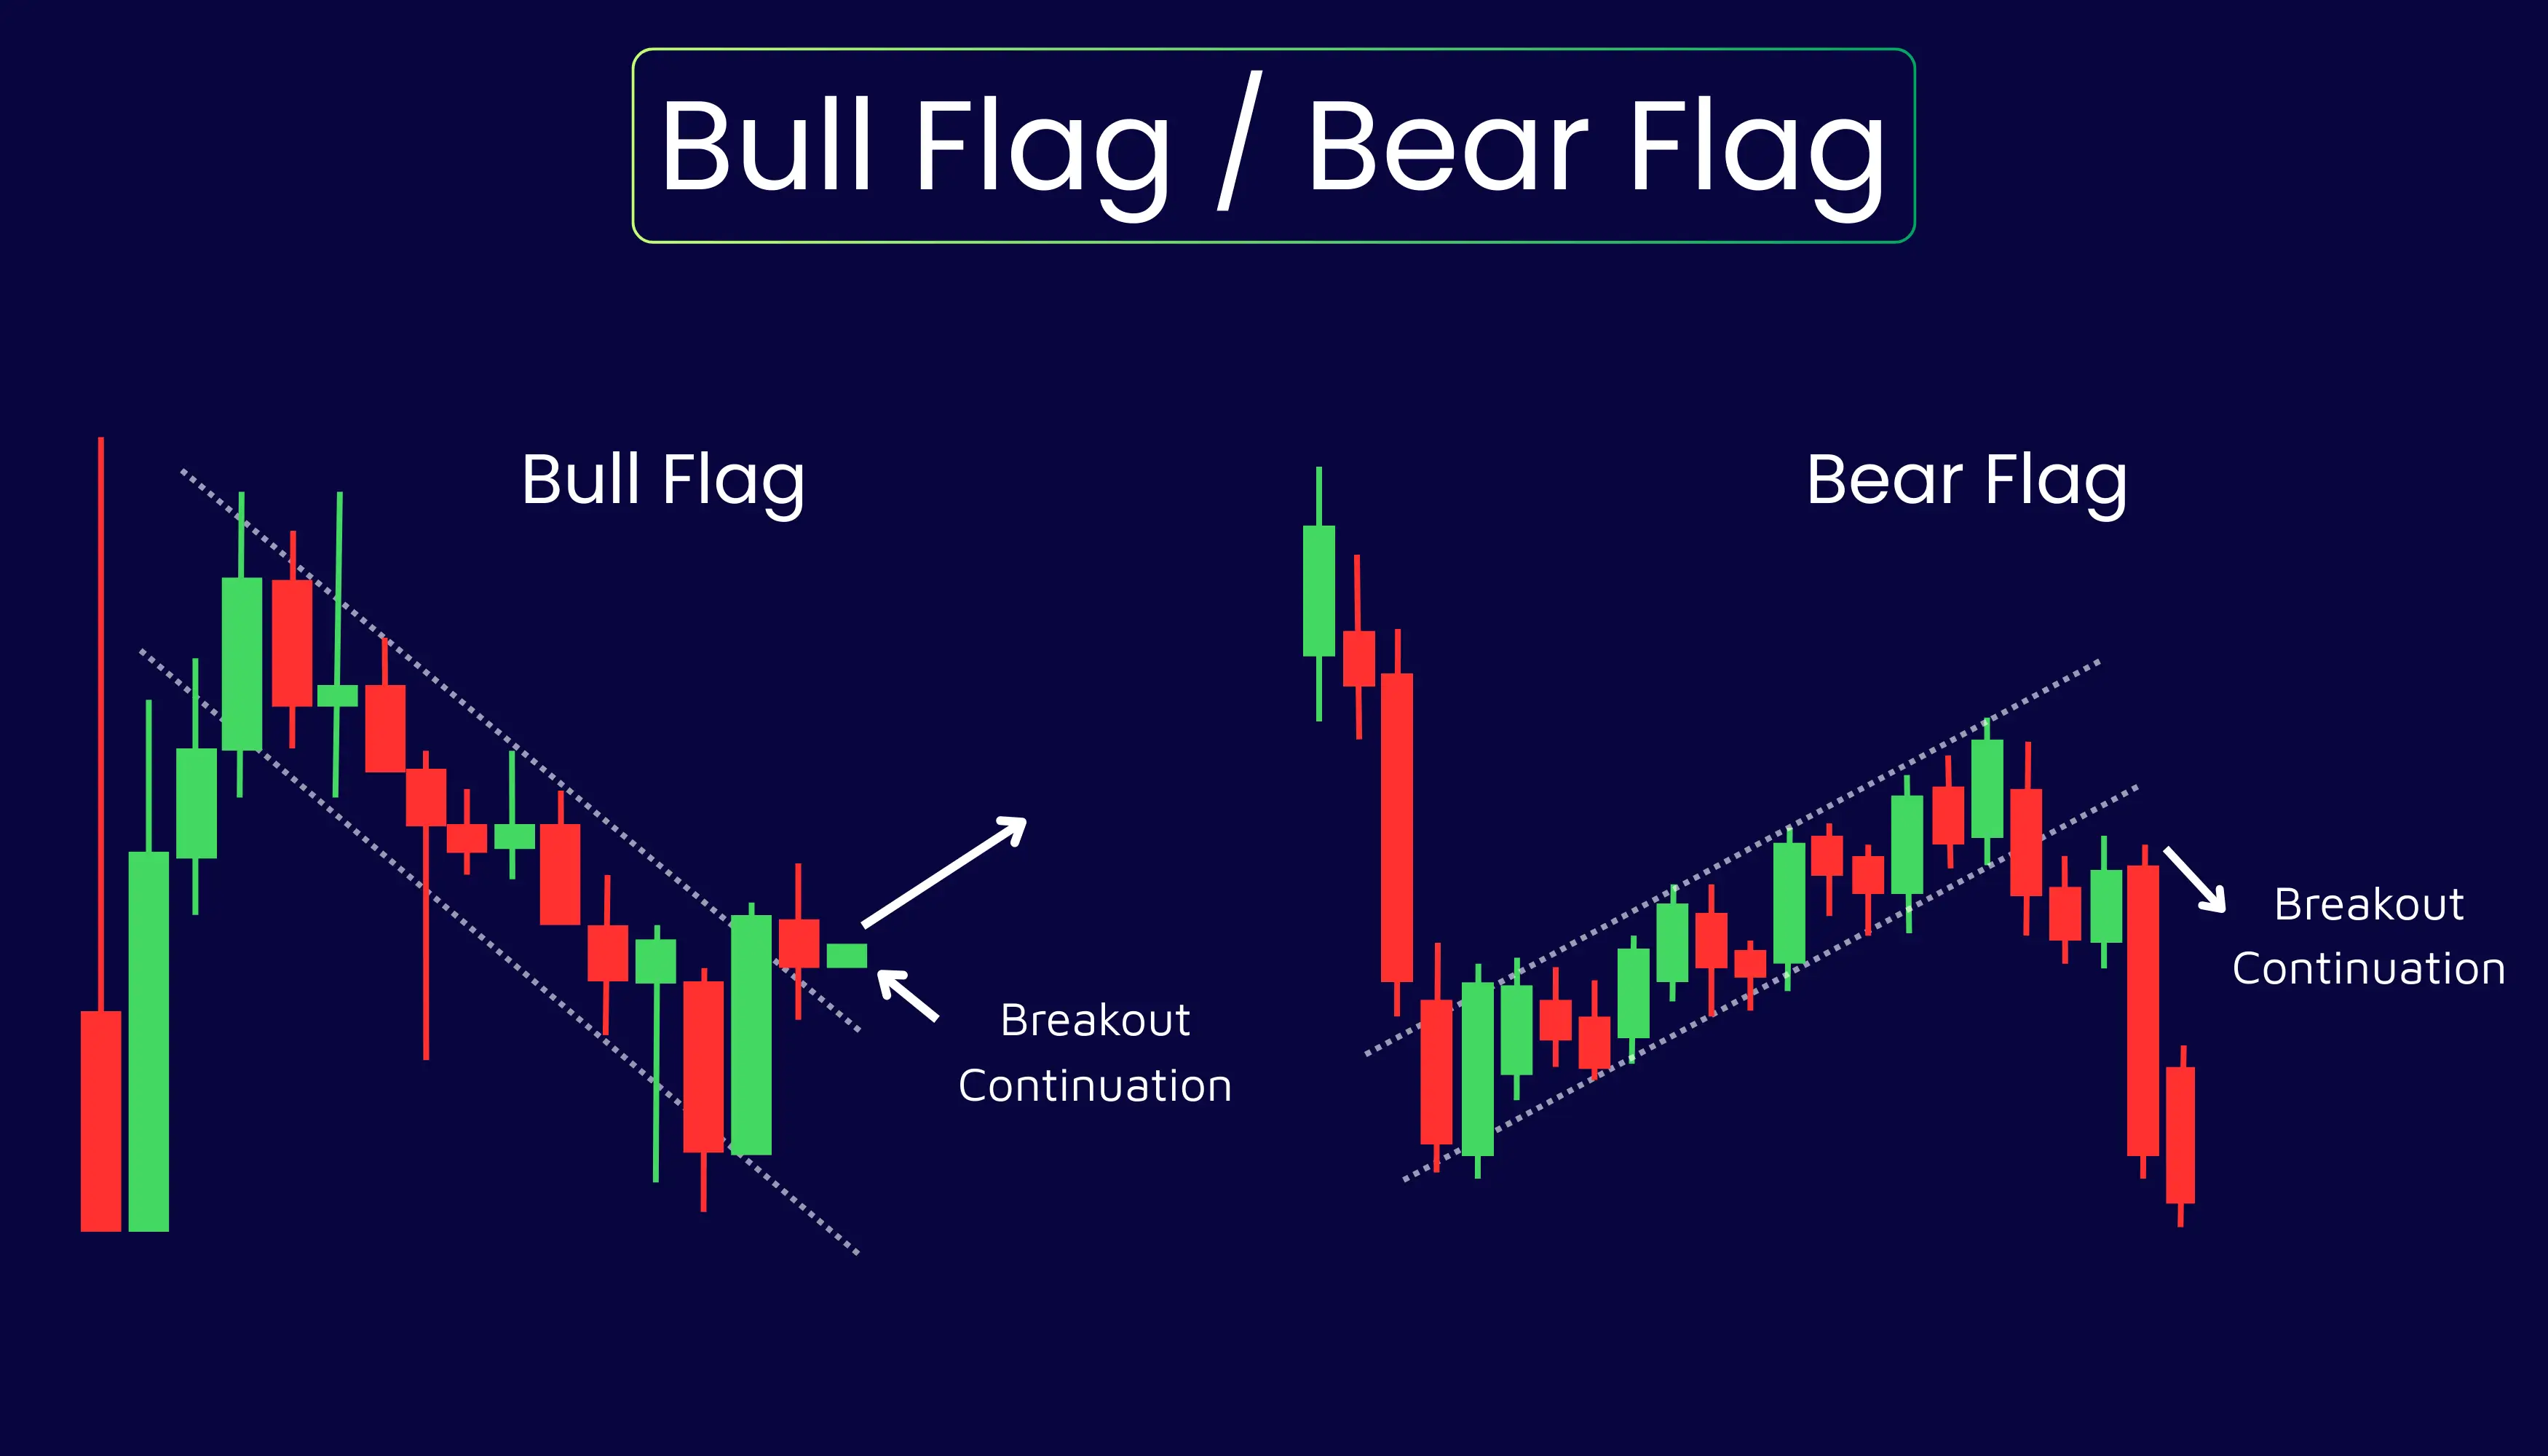
After a strong move (up or down), the price pauses and consolidates in a tight channel that slopes slightly against the trend. That’s the “flag.” Once the momentum returns, the price “breaks out” and continues in the original direction.
The bull flag is the pause after an uptrend, while the bear flag is the pause after a downtrend. These guys are best for spotting continuation setups.
Cup and Handle
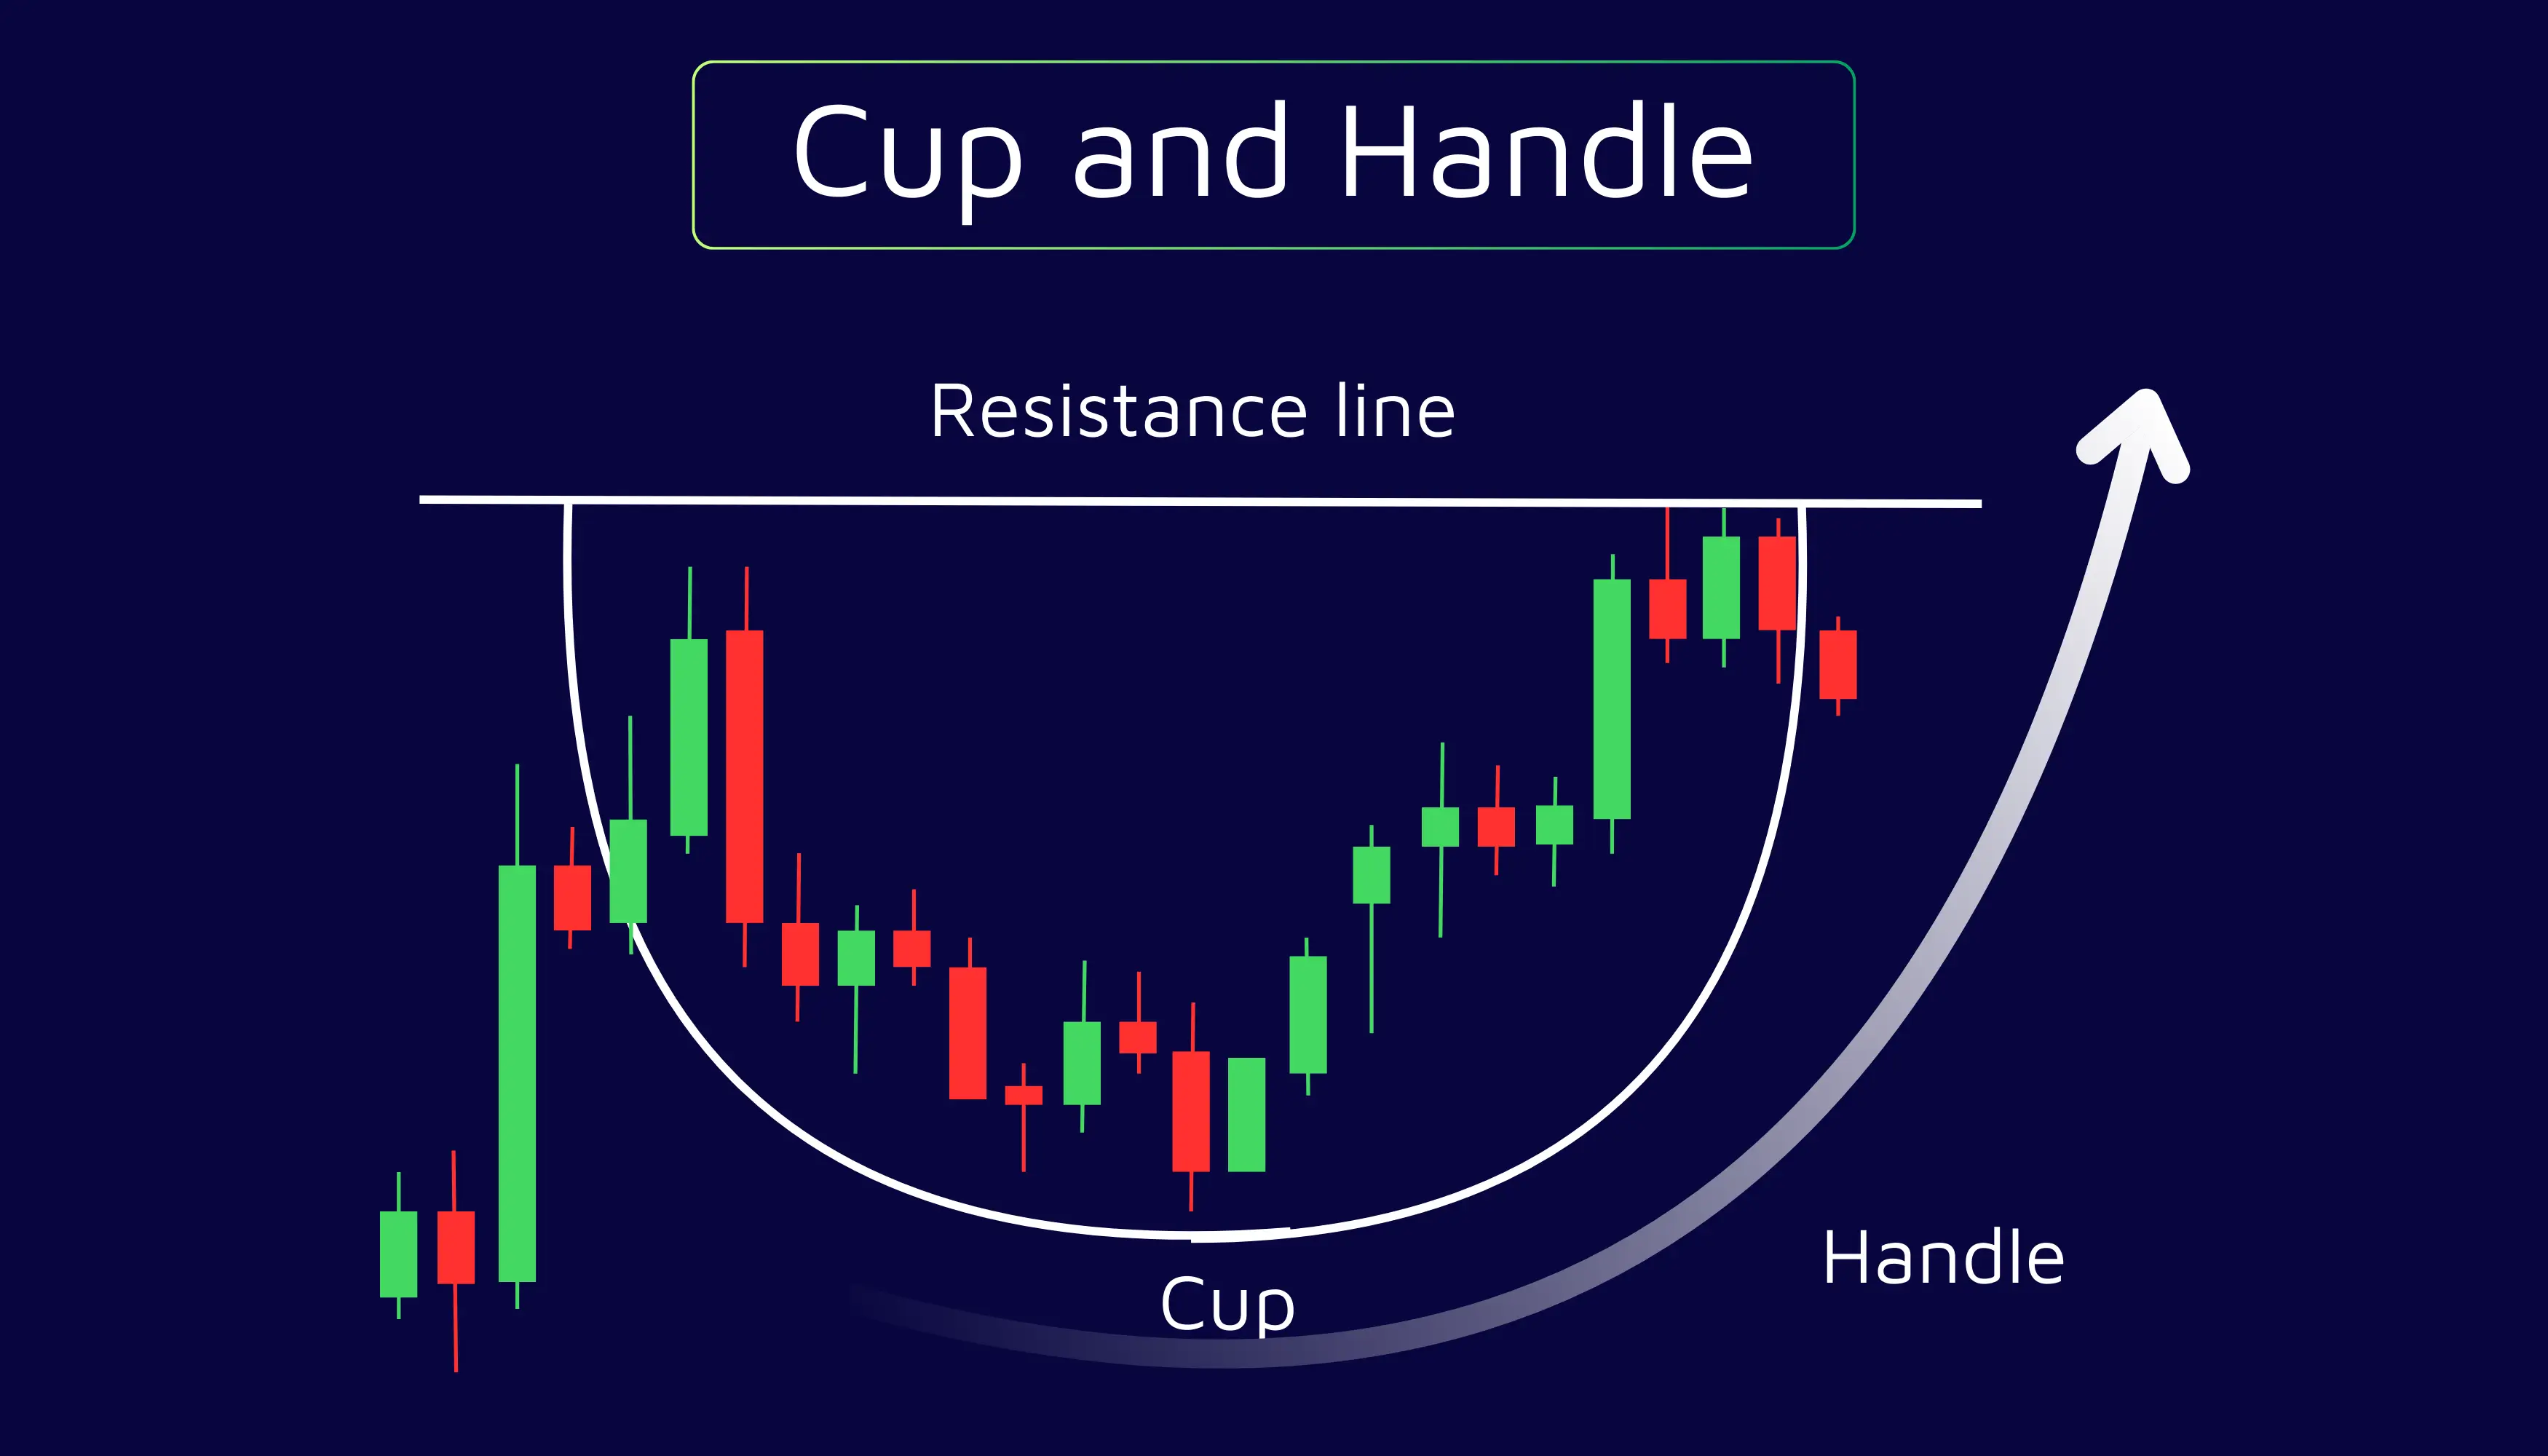
This pattern looks exactly like it sounds. The “cup” forms a rounded bottom (like a bowl), followed by a smaller pullback (the handle). A breakout above the handle’s resistance is the entry signal, which is often seen before strong bullish moves.
The cup and handle forms over a longer time frame (daily or 4-hour charts), and volume often dries up during the handle and spikes at the breakout.
Head and Shoulders / Inverse H&S
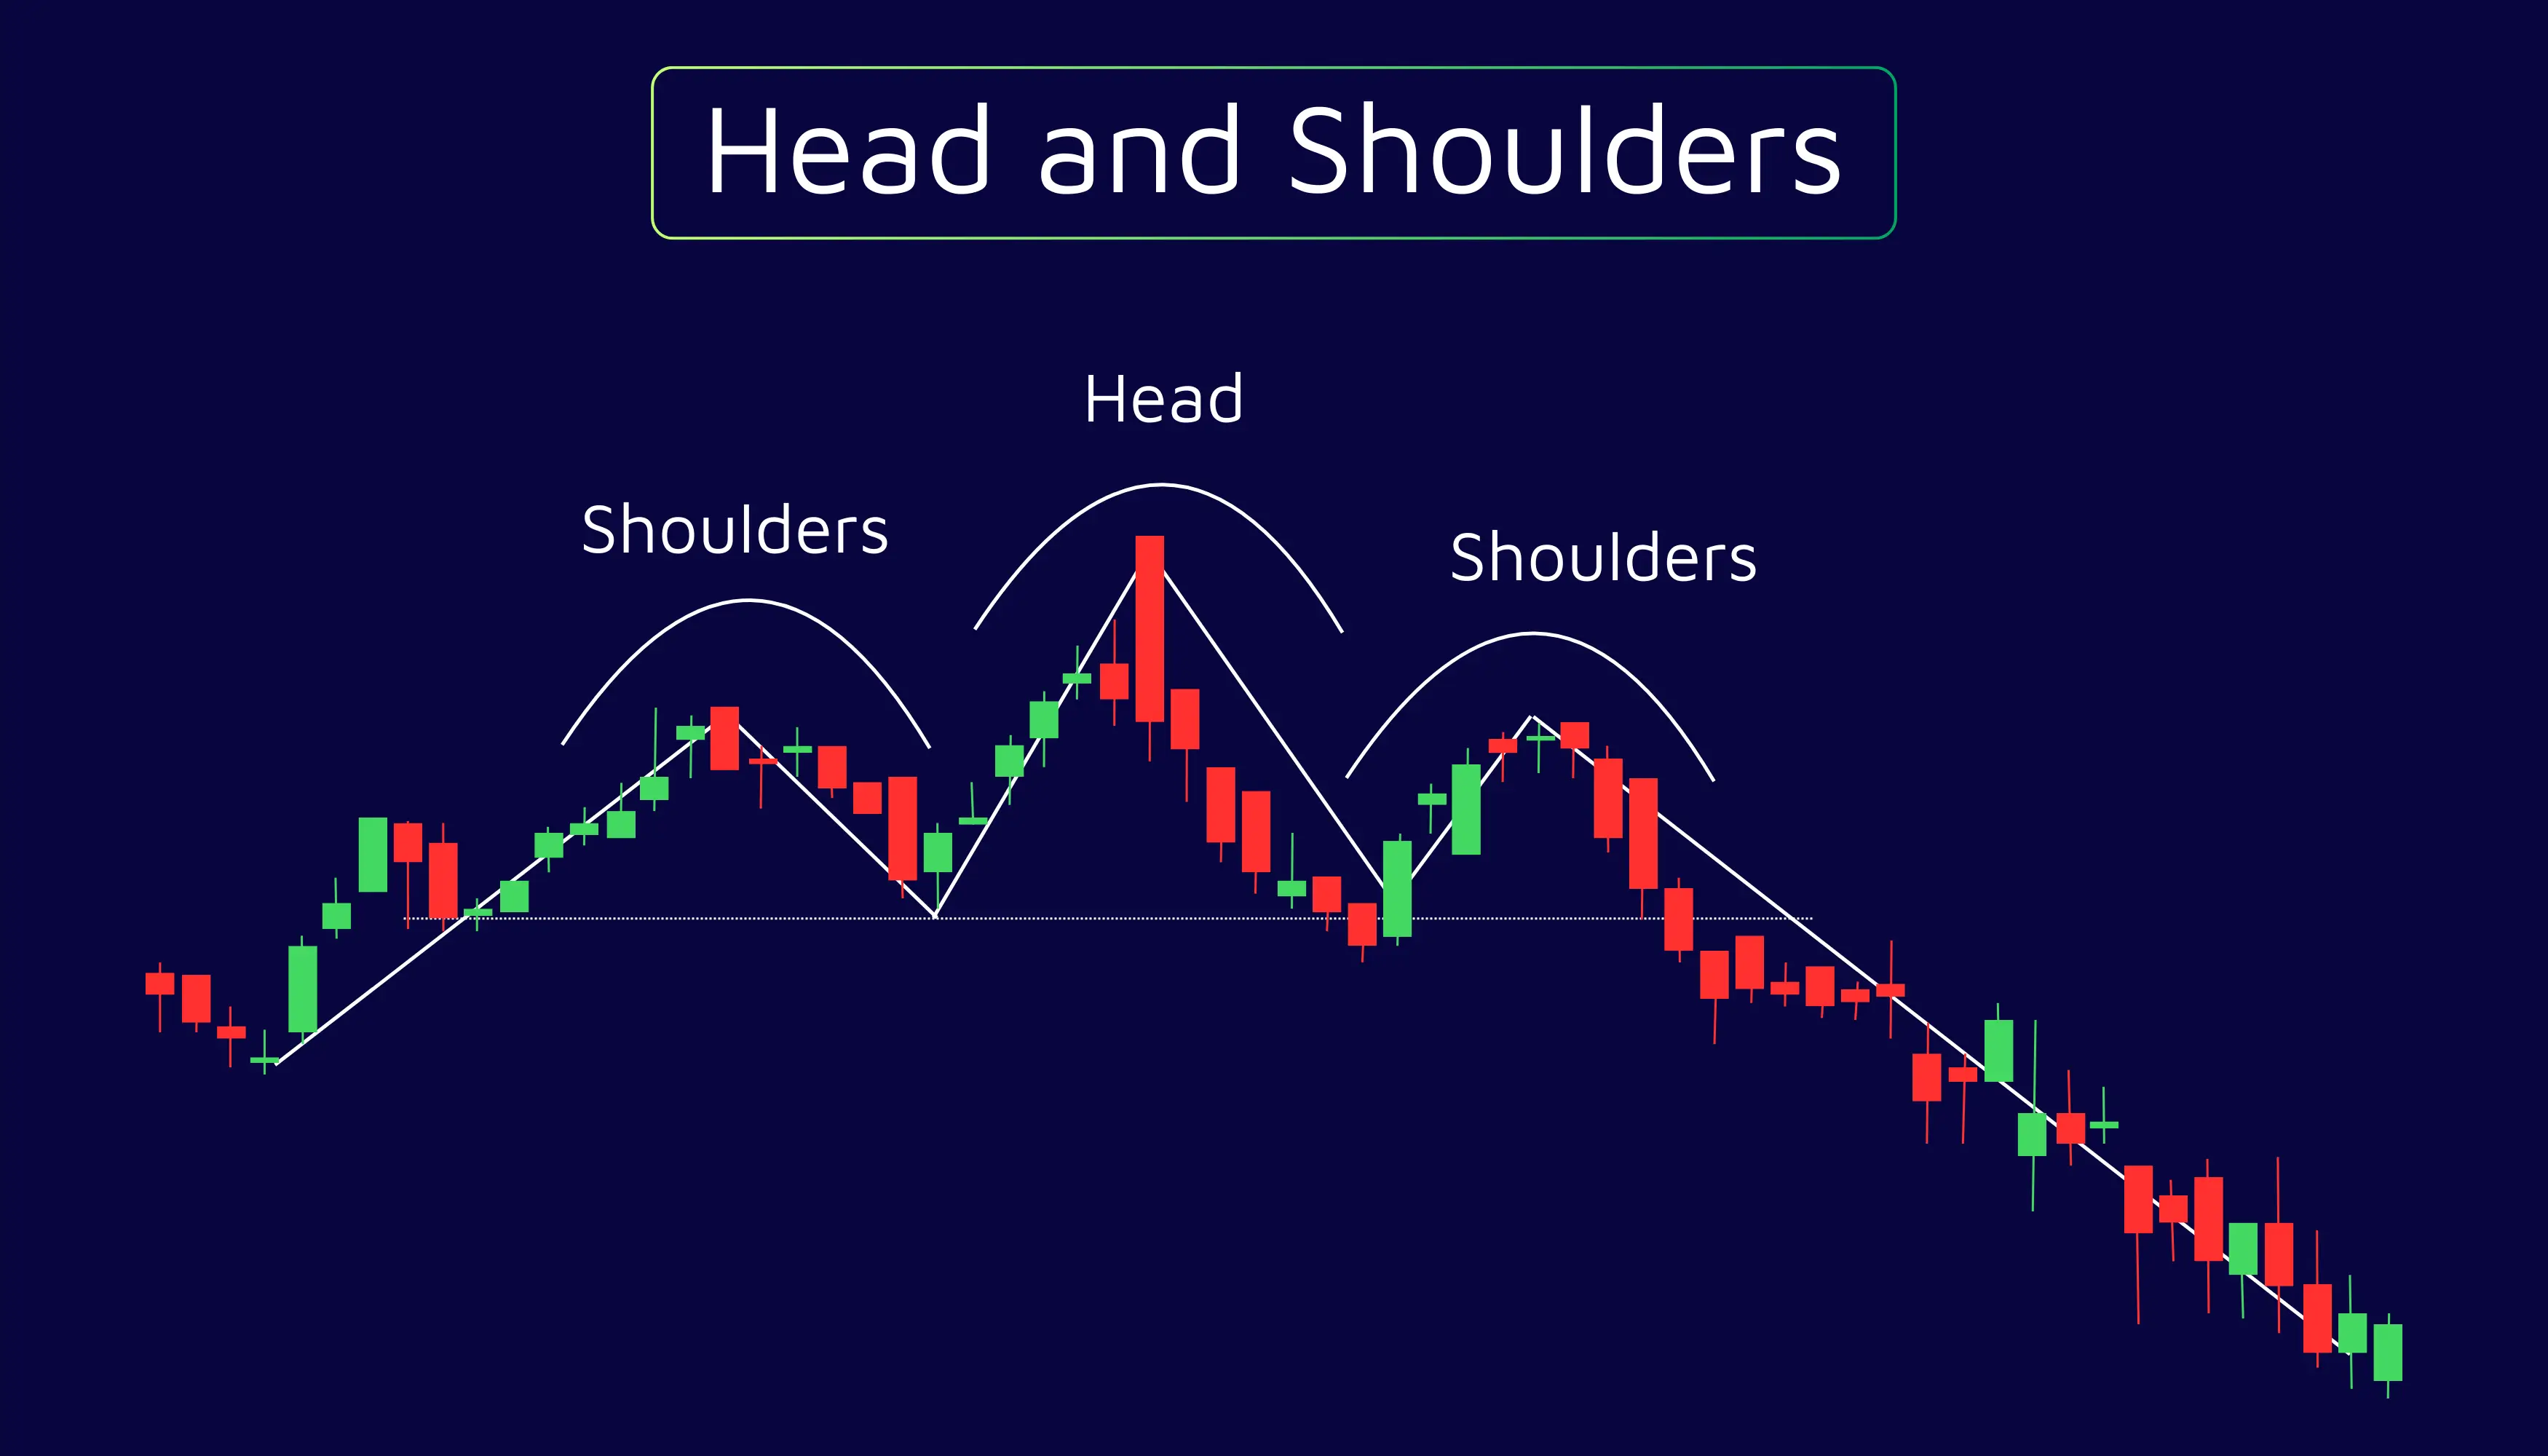
This one signals a potential reversal. It has three peaks: a tall “head” in the middle and two shorter “shoulders” on the sides. If the neckline breaks, you get a trend reversal.
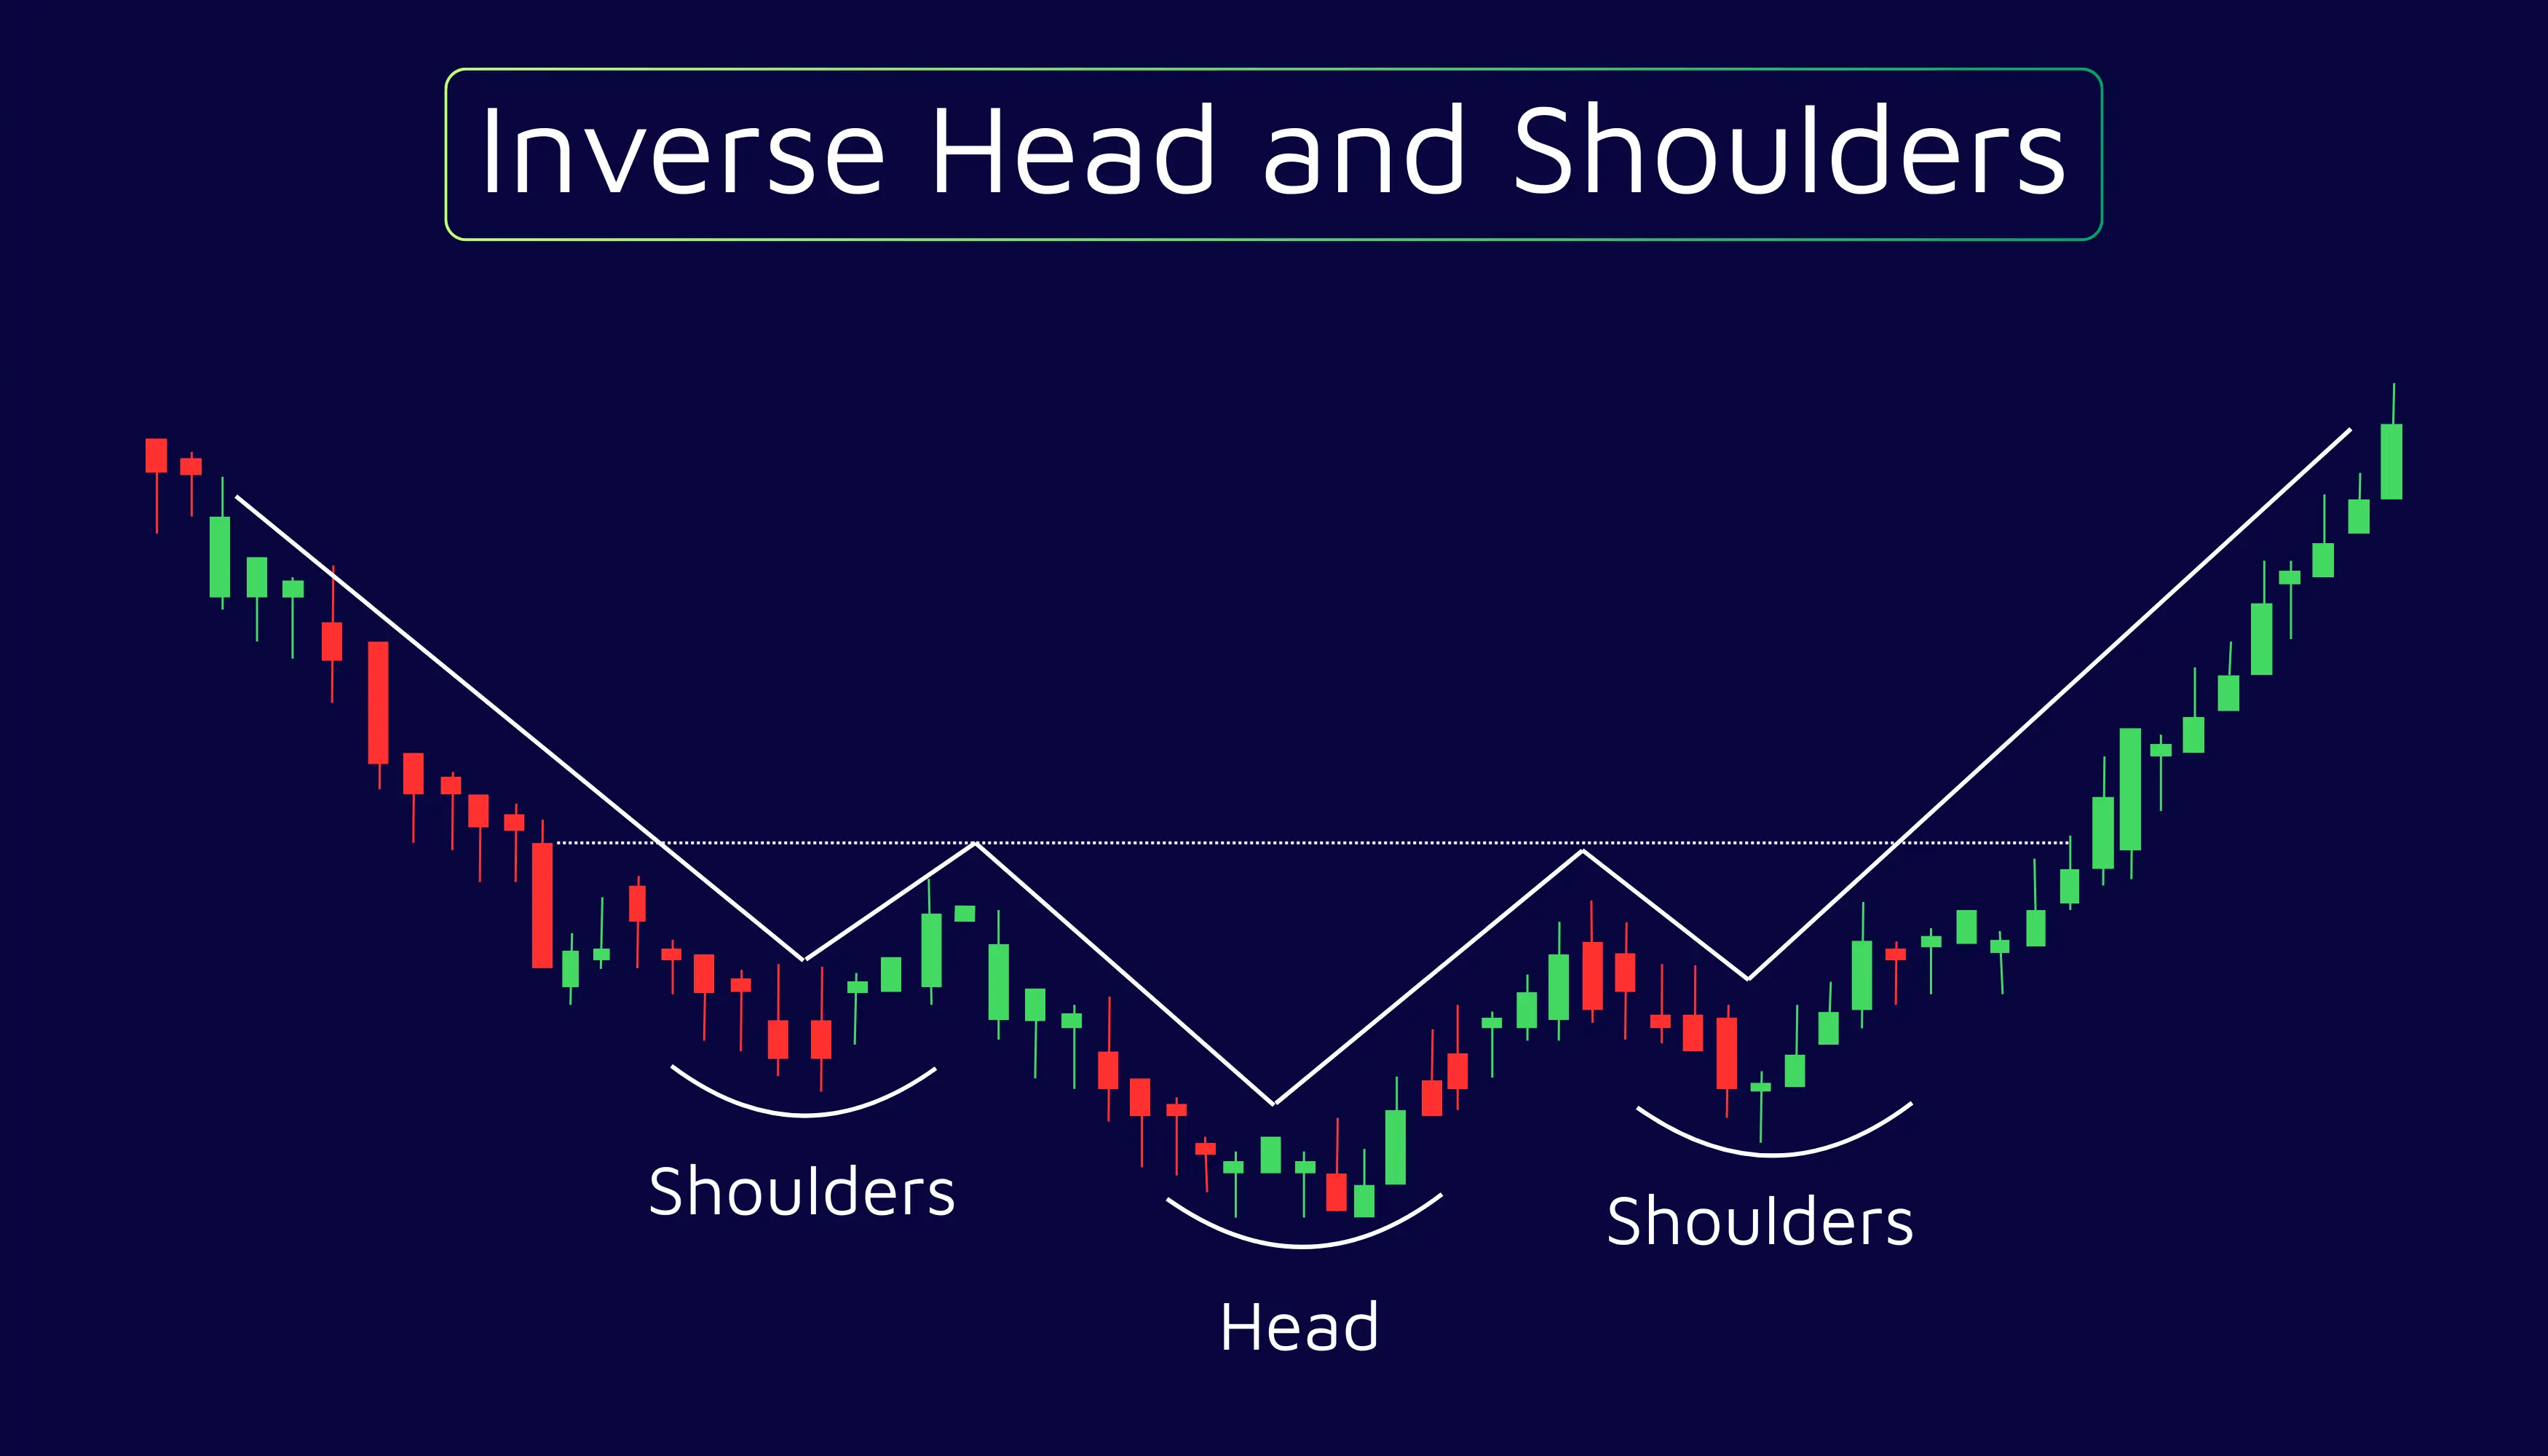
Regular H&S means there’s a bearish reversal, while inverse H&S signals a bullish reversal. They are best used to spot a trend exhaustion.
Double Top / Double Bottom
These patterns happen when the price hits the same level twice, but can’t break through.
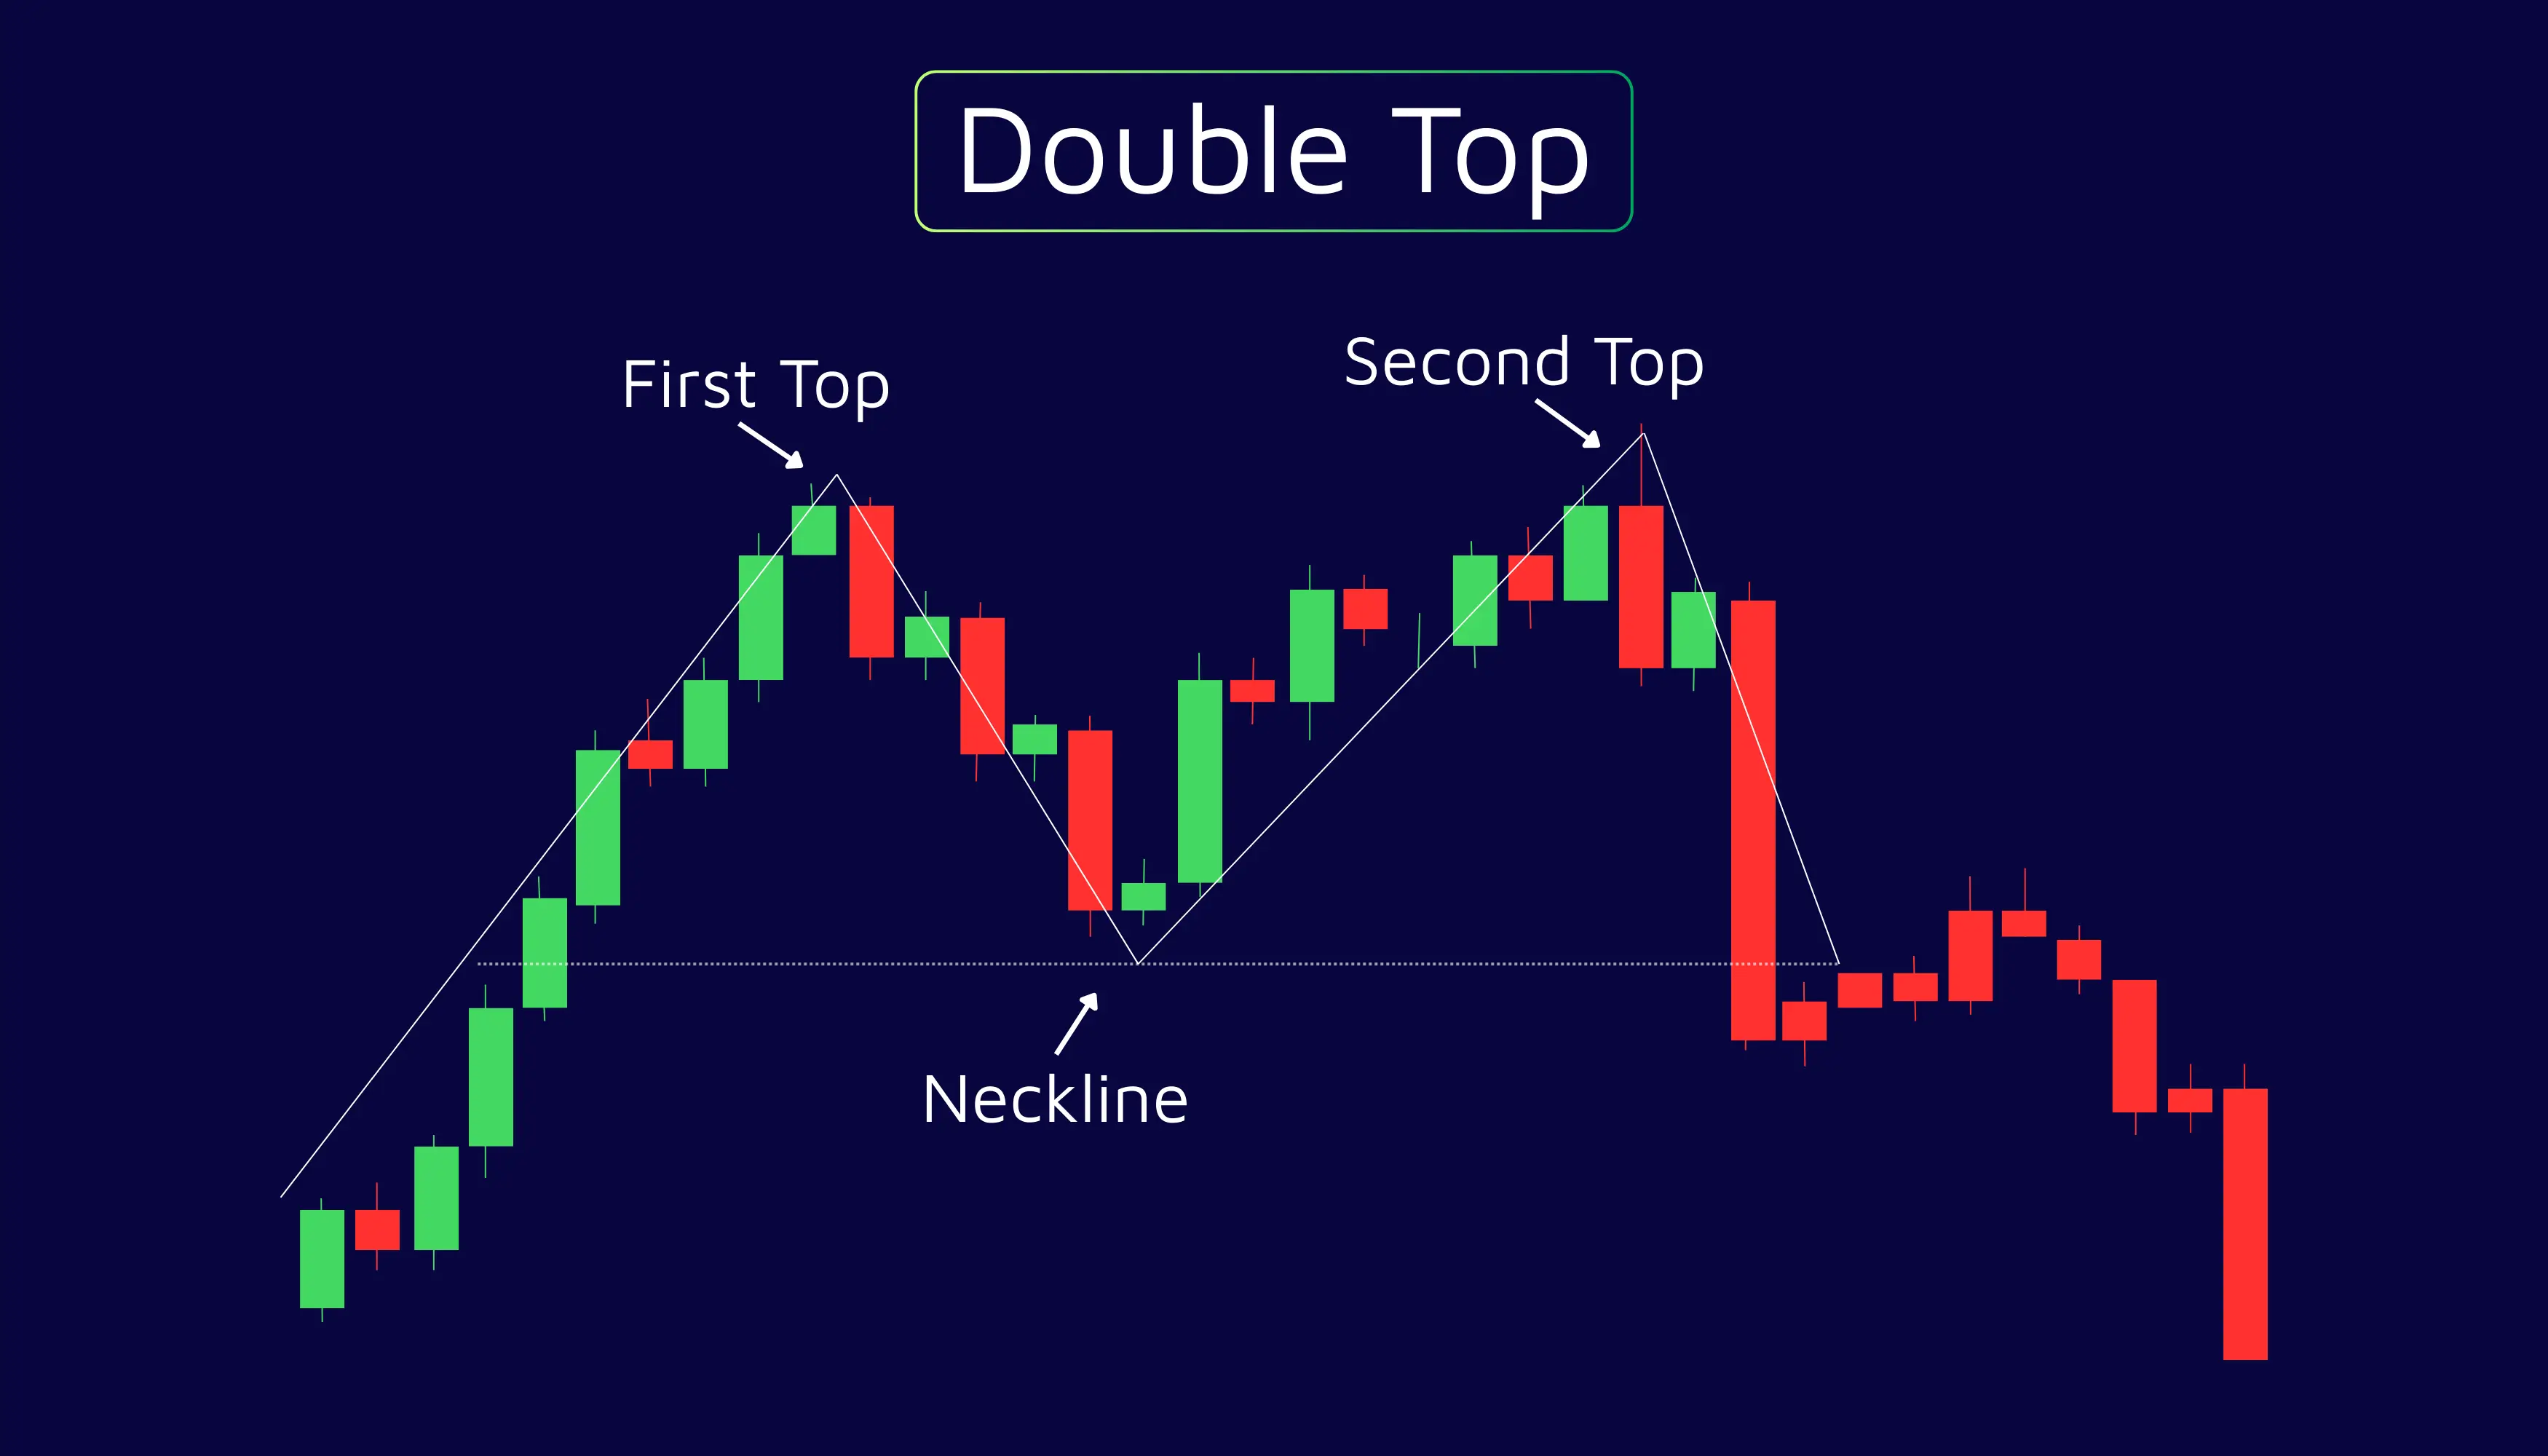
In a double top, price rises, pulls back, then rises again to the same level, and drops. This usually means the market has hit a ceiling and is about to fall. It's a bearish signal.
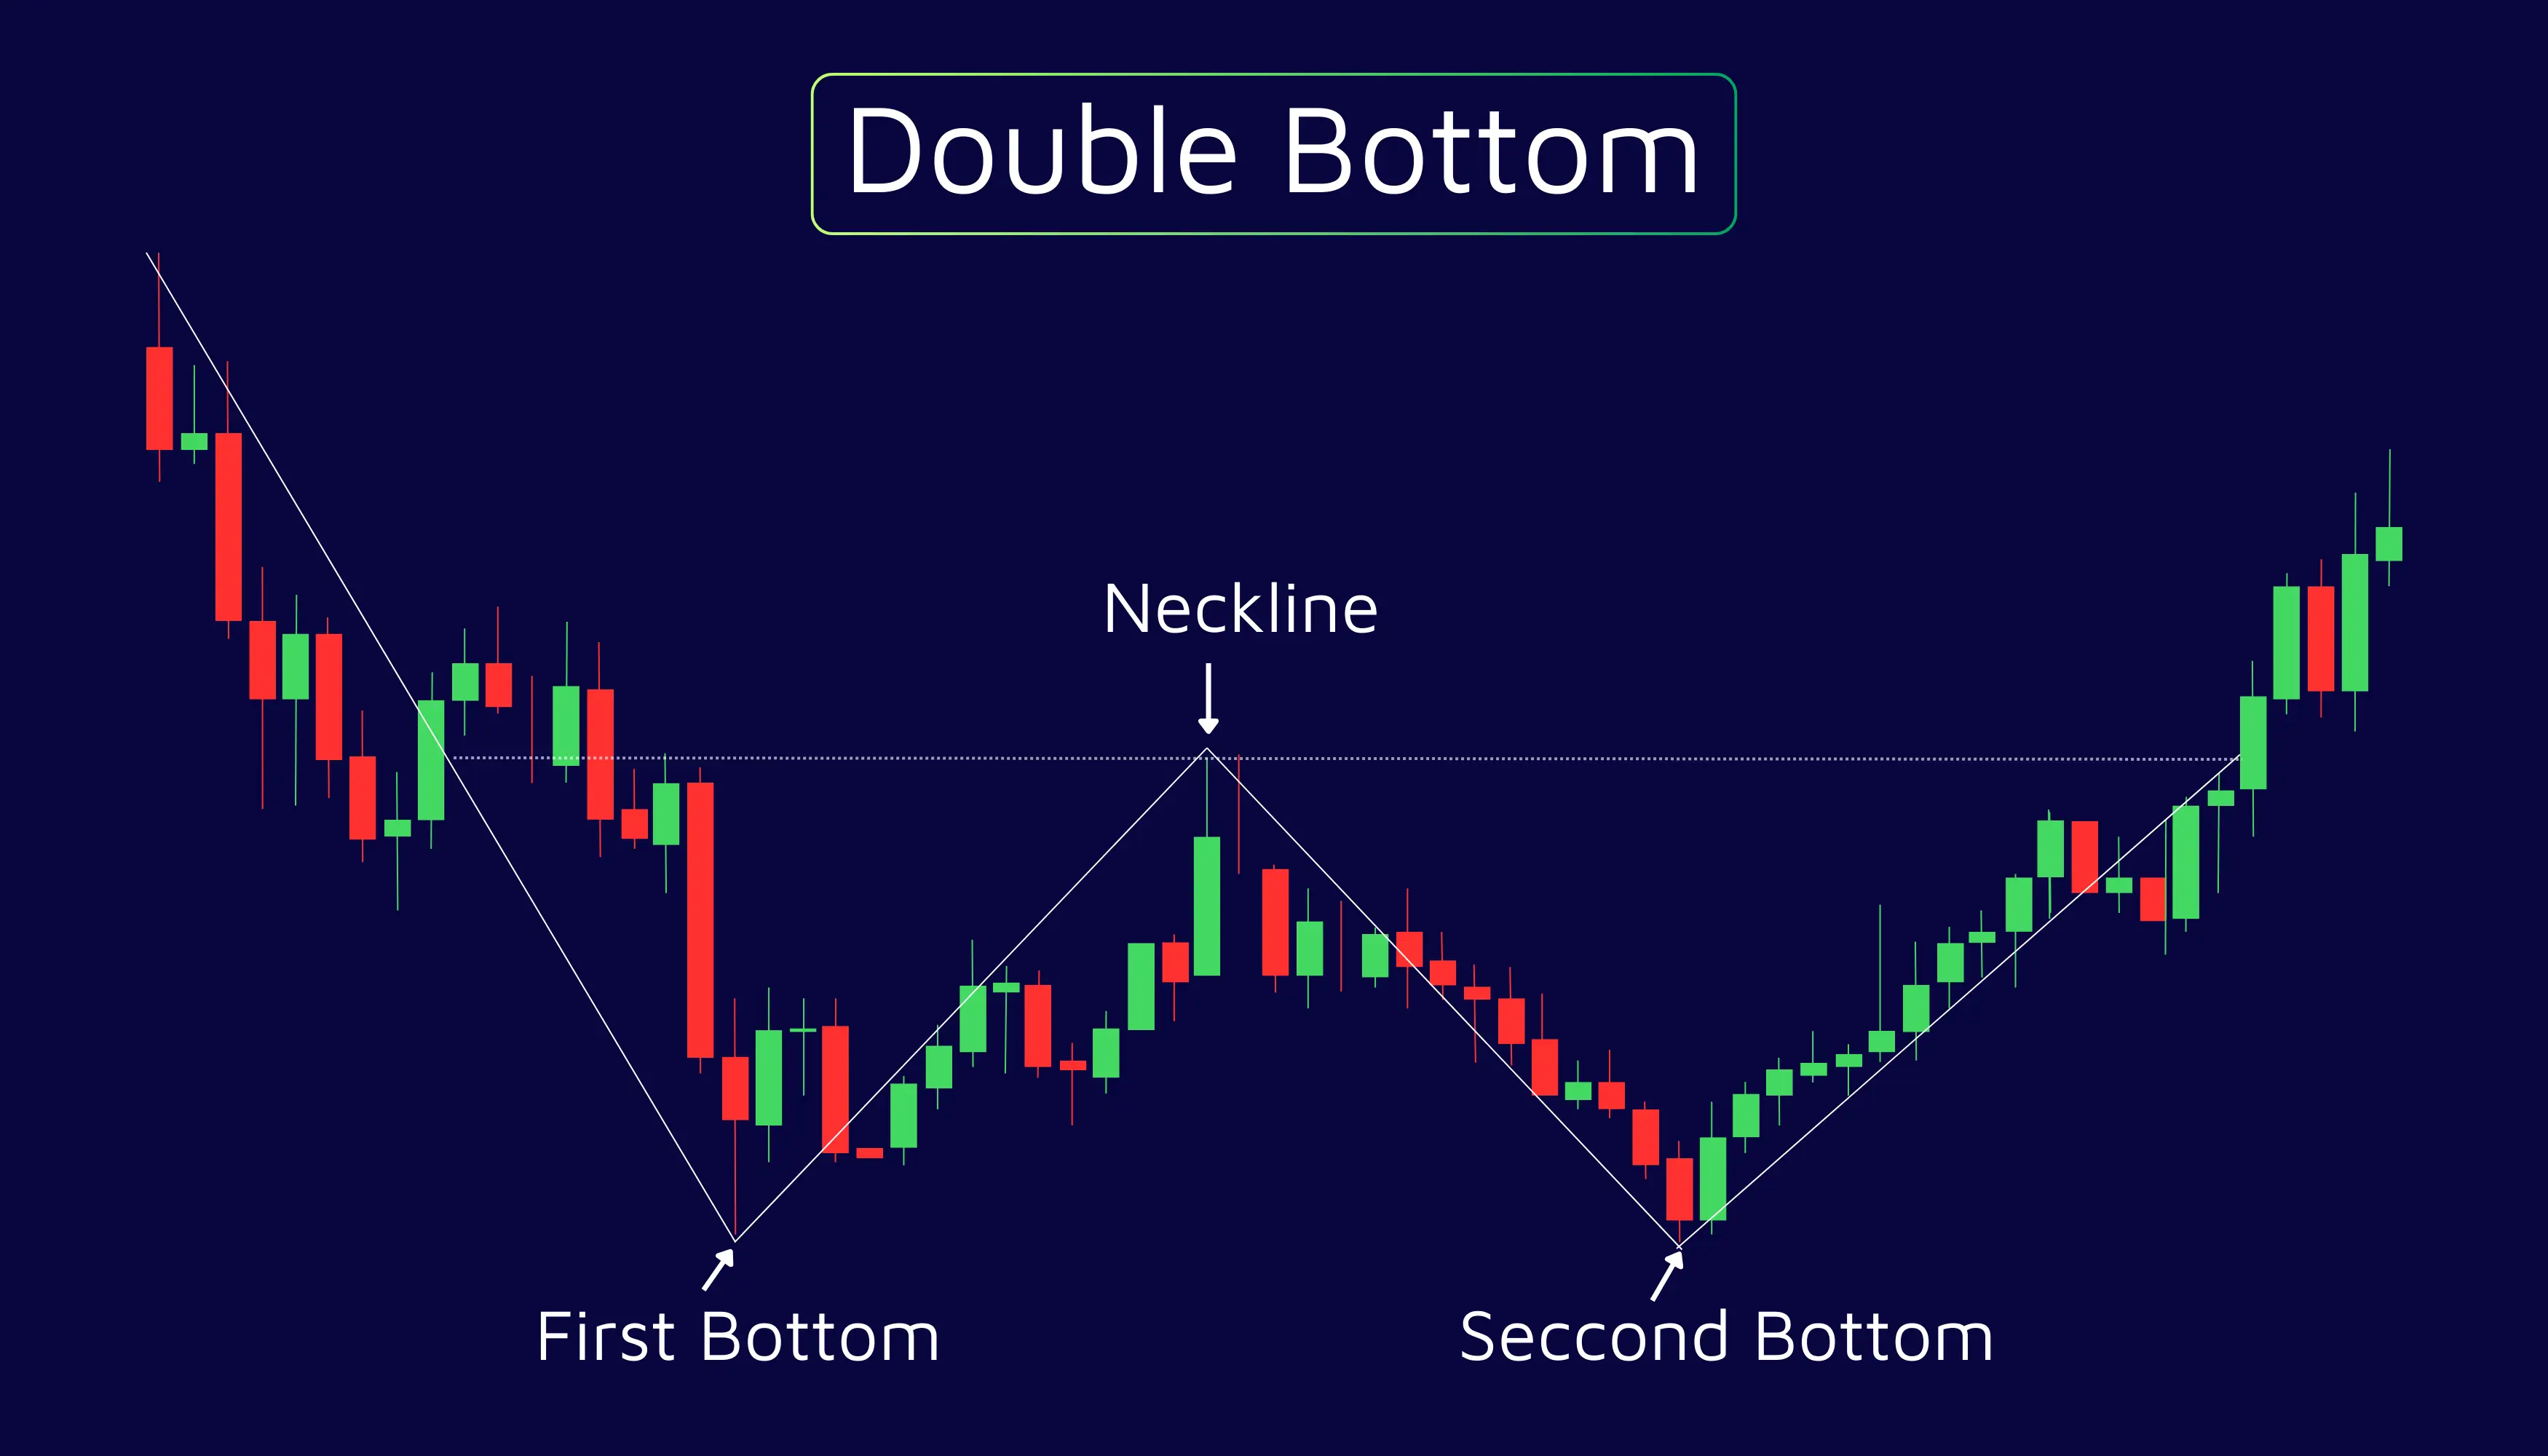
In a double bottom, price drops, bounces, then drops again to the same level, and rises.
This suggests the market has found a floor and may start going up. It is a bullish signal.
Here’s a quick tip. If the second attempt has less volume (there are fewer people trading), this pattern is more likely to work.
These setups are popular because they’re easy to spot and can be great clues that a trend is about to reverse.
Take Advantage of Technical Indicators. They Are Your Tools, Not Crutches
Indicators are there to support your analysis, not replace it. We like to think of them as a second opinion, not the final word.
For instance,
- RSI (Relative Strength Index) helps you spot when a currency pair is overbought (too high) or oversold (too low), while MACD (Moving Average Convergence Divergence) will show you the direction and momentum of the trend. So, if the lines cross or diverge, it could signal a change.
- The Stochastic Oscillator is similar to the RSI, but reacts a bit faster. It is great for spotting short-term momentum shifts.
- Volume, on the other hand, tells you how strong a price move is. A breakout with high volume is a good sign, but one with low volume is not so convincing.
Manage Risk Appropriately, i.e. Protect the Bag at All Costs
This is where the amateurs get smoked. They don’t prioritize risk management.
You should set stop-loss orders, know your position size, and never risk more than 1–2% of your account balance on a single trade.
Market Changes, So You ShouldContinue Learning
Because markets shift and strategies evolve, what worked last year might not work today.
Successful swing traders keep learning. If you take nothing else from this article, remember that swing trading success is a result of following key principles consistently.
From spotting trends and mastering support/resistance, to protecting your capital and staying disciplined, each part builds your edge.
F. Nathan
Felix Nathan is a professional trader, market analyst, and business development executive with over a decade of experience in the forex and financial markets. Felix specializes in providing actionable market insights, trading strategies, and risk man...