 IUX
IUX
 Exness
 Vantage
 XM
XM
 ICMarkets
 LiteFinance
 Moneta
 Tickmill
 South Africa (9)
 India (9)
 Bangladesh (12)
 Germany (9)
 Thailand (10)
 Philippines (9)
 Nigeria (10)
 Vietnam (10)
 Malaysia (9)


The Fractal Approach & Key Rules of Elliott Wave Theory


Share:
Share:
Strategy
9 min read
Elliott Wave Theory is a powerful form of technical analysis that identifies recurring long-term price patterns shaped by investor psychology.
At its core, it reveals that financial markets move in predictable, repetitive cycles, much like natural fractals found in nature. While primarily a descriptive tool for understanding market structure, Elliott Wave Theory also offers predictive insights, helping traders forecast potential market moves with greater confidence.
This clever blend of psychology and pattern recognition is your golden ticket behind the market’s curtain. It’s like having eyes in the back of your head—letting you read between the lines and stay one step ahead of the game.
Ready to crack the code and master the market’s fractal dance?
Let’s dive in and uncover the essential rules that govern every wave.
What is a Fractal?
So, what exactly is a fractal, and why does it matter in trading?
A fractal is a repeating pattern that looks the same at different scales.
Think of snowflakes, coastlines, or even broccoli. This natural pattern repeats itself no matter how closely you zoom in or out.
Elliott Wave Theory applies this fractal concept directly to financial markets.
Market Application
In the market, price movements form waves that mirror these fractal patterns. Each wave contains smaller waves inside it, and those smaller waves have even tinier waves within them.
This self-similar structure helps traders analyze complex market behavior across different time frames, from minutes to months.
For example, a short-term 5-wave pattern on an intraday chart can be part of a larger 5-wave move on a weekly chart.
And do you know what?
This creates a powerful map of market sentiment and psychology. Interesting.
Degrees of Waves
Understanding degrees of waves is crucial here.
Why?
From the smallest minor waves to massive grand supercycles spanning decades, each level fits neatly within the next.
Famous traders like Robert Prechter have used this fractal approach to anticipate major market moves, such as predicting the 1987 stock market crash. Recognizing fractals in price action gives you a special advantage and definitely allows you to see the market’s hidden order even in what seems like chaos.
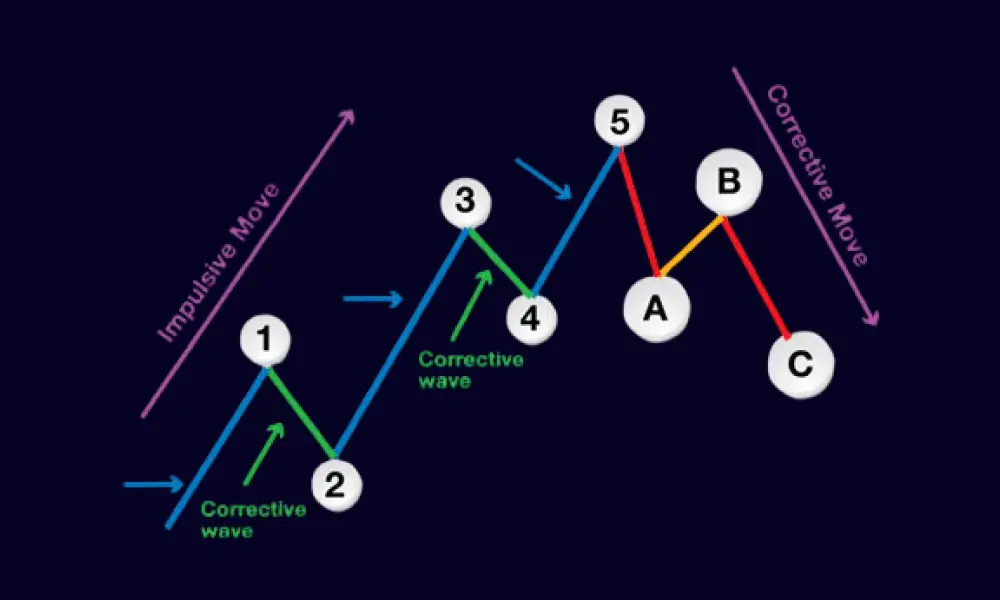
Basic Wave Pattern
Elliott Wave Theory centers on the fundamental rhythm: the basic wave pattern that drives all market movements.
This pattern is a repeating cycle of eight waves, five waves pushing with the main trend, followed by three waves pushing against it. You master this pattern and unlock the market’s psychology and price action blueprint. It helps you anticipate future moves.
Impulse Waves: The 5-Wave Drive Forward
Impulse waves are the market’s powerhouse. They consist of five waves labeled 1 to 5. These waves move with the main trend.
In a bull market, impulse waves push prices higher in clear steps. Waves 1, 3, and 5 are “motive” waves that drive the trend forward. Waves 2 and 4 are “corrective” waves—brief pauses before the next surge.
For example, during a strong uptrend in Apple’s stock, wave 1 could represent the initial rally as buyers gain confidence, wave 2 a minor pullback as some traders take profits, wave 3 a powerful surge fueled by widespread optimism, wave 4 a short pause, and wave 5 the final push as enthusiasm peaks.
What happens next is a bit like a movie within a movie.
How?
Each impulse wave hides smaller sub-waves, each playing out its mini storyline. This fractal habit means the drama keeps repeating across every timeframe, from the blink-and-you-miss-it moments to the epic, slow-burning sagas.
Corrective Waves: The 3-Wave Pullback
After the impulse waves complete, the market doesn’t just rocket endlessly—it needs a breather.
Really!
This is where corrective waves come in, labeled A, B, and C. Corrective waves move against the direction of the larger trend. And this often retraces a portion of the gains made during the impulse phase.
Take the same Apple example: after the 5-wave uptrend, waves A and C represent downward moves, as sellers temporarily dominate, while wave B is a smaller bounce or rally that tries to push prices higher but fails to reach previous highs.
This 3-wave correction allows the market to “reset” and prepare for the next cycle.
The 5-3 Complete Cycle: Markets in Motion
Have you ever heard of Russian nesting dolls? Imagine each 8-wave cycle fitting neatly inside a larger 5-3 pattern, which itself fits into an even bigger one. Pretty wild, right?
This fractal pattern repeats across all timeframes, from quick minute charts to trends lasting decades.
How do you think this helps traders?
Would you zoom in for short-term trades or step back for long-term strategies?
Key Rules of Impulse Waves (Never Violated)
Elliott Wave Theory is built on some ironclad rules, especially when it comes to impulse waves.
These rules are never broken. Yes, you have read that right.
If they are, it means the wave count is wrong, and the analysis needs adjusting.
And when you understand these unbreakable laws, you spot valid wave patterns and avoid costly mistakes.
Because let’s face it, losing money because you ignored the waves?
That’s like trying to surf with a broken board, messy and avoidable!
Rule 1: Wave 2 Never Retraces More Than 100% of Wave 1
Simply put, Wave 2 can pull back, but it can never drop below the starting point of Wave 1. Imagine you bought a stock at $50 (start of Wave 1) that rose to $70 (end of Wave 1).
Wave 2 can retrace some gains but can’t fall below $50. If it does, the pattern breaks, and the wave count must be reconsidered. This rule ensures the trend remains intact and avoids the illusion of a new impulse wave when the market is actually reversing.
Rule 2: Wave 3 is Never the Shortest Impulse Wave
Wave 3 is usually the star of the show — the strongest and most energetic wave. It can never be the shortest compared to Waves 1 and 5.
For instance, if Wave 1 climbs 10 points and Wave 5 moves up 8, Wave 3 has to top them both, often making the biggest leap. This happens because the market’s momentum naturally builds here, with traders showing their strongest conviction right in the middle.
Rule 3: Wave 4 Never Overlaps Wave 1 Price Territory
Wave 4’s low (in a bull market) cannot fall into the price range of Wave 1’s high. If it does, it breaks this key rule. For instance, if Wave 1 peaked at $100, Wave 4 cannot dip below that level before Wave 5 starts. This prevents confusing sideways moves with trend reversals, keeping the wave structure clean and identifiable.
Guidelines for Impulse Waves (Often Followed, but Can Be Violated)
Unlike strict rules, impulse wave guidelines are more like helpful road signs than hard laws.
They point you in the right direction but don’t guarantee a perfect path—because real markets love to throw curveballs.
For example, Wave 3 is usually the longest and strongest, but sometimes Wave 5 steals the spotlight with an unexpected extension. Wave 4 often pulls back just a little, yet every now and then it dives deeper than expected.
These flexible guidelines help traders adapt Elliott Wave Theory to real-world market chaos. They strike a balance between following structure and staying practical.
So, would you stick rigidly to the rules or roll with the market’s surprises?
Key Characteristics & Forms of Corrective Waves
Corrective waves are where Elliott Wave Theory gets tricky. Unlike impulse waves that push the trend forward, corrective waves move against it. They often show more complex patterns, making them harder to spot and analyze.
Complexity
Corrective waves are like the plot twists in a thriller—never straightforward and always keeping you guessing. They don’t stick to one script but show up in different shapes, each with its quirky personality.
Variety of Patterns
Zigzags
Zigzags are sharp corrections with a clear 5-3-5 wave structure. They tend to be fast and steep, pulling prices back sharply before the trend resumes. For example, after a strong uptrend, a zigzag correction might sharply retrace 50-61.8% of the prior move.
Flats
Flats move sideways, following a 3-3-5 pattern. Here, prices retrace more gently, often moving nearly equal to the previous impulse wave. Flats can feel like market indecision, with a bounce in Wave B that nearly reaches Wave A’s start.
Triangles
Triangles are more complex sideways formations composed of five waves, each subdividing into three smaller waves (3-3-3-3-3). Triangles indicate consolidation before the final push in the direction of the larger trend.
Double/Triple Threes
Sometimes, corrections combine into double or triple threes, which are linked sequences of simpler corrective patterns, increasing the correction’s complexity and duration.
No Overlap Rule (for Zigzags in a Trending Market)
A critical rule for simple zigzags in trending markets is the No Overlap Rule: Wave B typically does not move beyond the start of Wave A. Breaking this indicates a different pattern or wave count.
Common Retracements
Corrective waves love to boomerang right back to the classic Fibonacci hangouts—38.2%, 50%, or 61.8%. Consider these levels as the market’s favorite pit stops before it decides where to head next.
Also, nail these spots, and you’ll dodge some expensive plot twists in your trading drama.
Importance & Limitations
Elliott Wave Theory reveals the underlying pattern in the market. It shows the psychology behind price movements. Because of this, traders gain valuable insight. This helps them predict trends and reversals with greater confidence.
Its fractal design means you can use it on any timeframe. Doesn’t matter whether you’re trading minutes or years.
But it’s not perfect.
Wave counts can be tricky and open to different views. Markets don’t always play by the rules, and outside forces can shake things up.
That’s why Elliott Wave works best when combined with other tools and smart risk management.
Conclusion
You’ll find Elliott Wave Theory reveals the market’s hidden rhythms, which blend trader psychology with fractal math to forecast moves. It’s not flawless, but mastering it sharpens your insight and boosts your trading edge.
What you really need to do is use its power wisely and watch how it transforms your market approach. Good Luck!
F. Nathan
Felix Nathan is a professional trader, market analyst, and business development executive with over a decade of experience in the forex and financial markets. Felix specializes in providing actionable market insights, trading strategies, and risk man...