 IUX
IUX
 Exness
 Vantage
 XM
XM
 ICMarkets
 LiteFinance
 Moneta
 Tickmill
 South Africa (9)
 India (9)
 Bangladesh (12)
 Germany (9)
 Thailand (10)
 Philippines (9)
 Nigeria (10)
 Vietnam (10)
 Malaysia (9)


How to Identify Patterns in Forex?


Share:
Share:
Education
7 min read
A "successful" pattern is one that consistently provides favorable risk-to-reward opportunities and aligns with a trader's overall methodology.
To find the successful ones that work for you, you first need to identify chart patterns in Forex and implement every type of pattern.
The most common way to identify Forex patterns in charts or candlesticks is by visually recognizing recurring geometric shapes formed by price action (chart patterns) or specific candle formations (candlestick patterns).
These visual cues help traders anticipate potential future price movements, whether they signal a trend continuation or reversal.
Let's move on and learn some core basics of identifying hidden Forex patterns below.
Here’s Why You Must Look Out for Patterns in Forex Trading
Forex chart patterns help traders understand what that price has done in the past and what it might do next.
These formations reveal psychological levels of support, resistance, momentum, and trend behavior.
Two main types of Forex patterns:
- Reversal patterns tend to hint at a trend change. For instance, double top, head, and shoulders.
- Continuation patterns mostly suggest the current trend will continue. For example, flags, and triangles.
When you combine technical analysis, price action, and pattern recognition, you can find better entry points, set realistic profit targets, and place stop-loss orders with confidence.
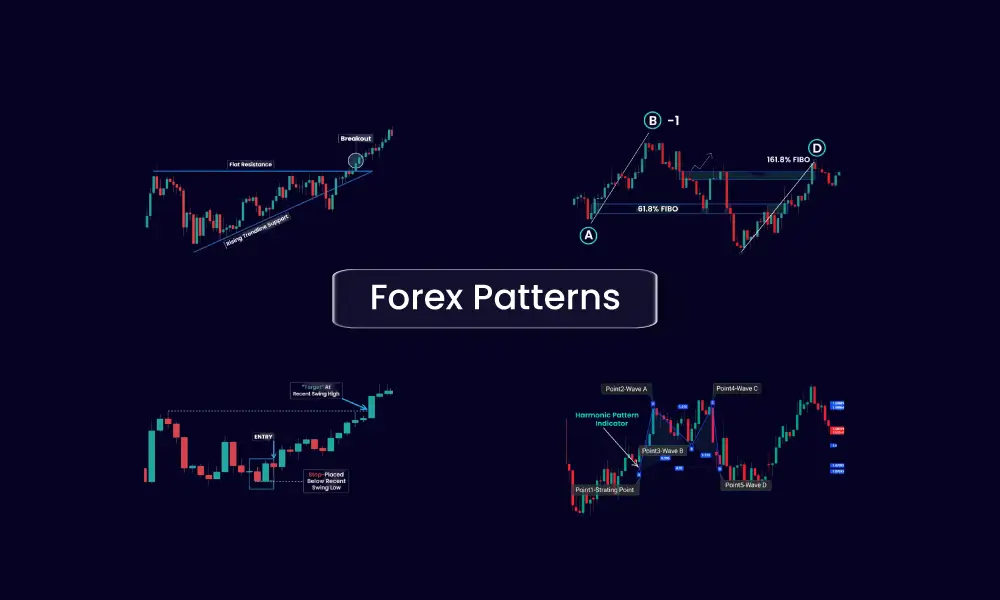
Identify 7 Common Chart Patterns in Forex
As a trader, you should know these patterns. Let’s break down the most common and powerful patterns in forex trading:
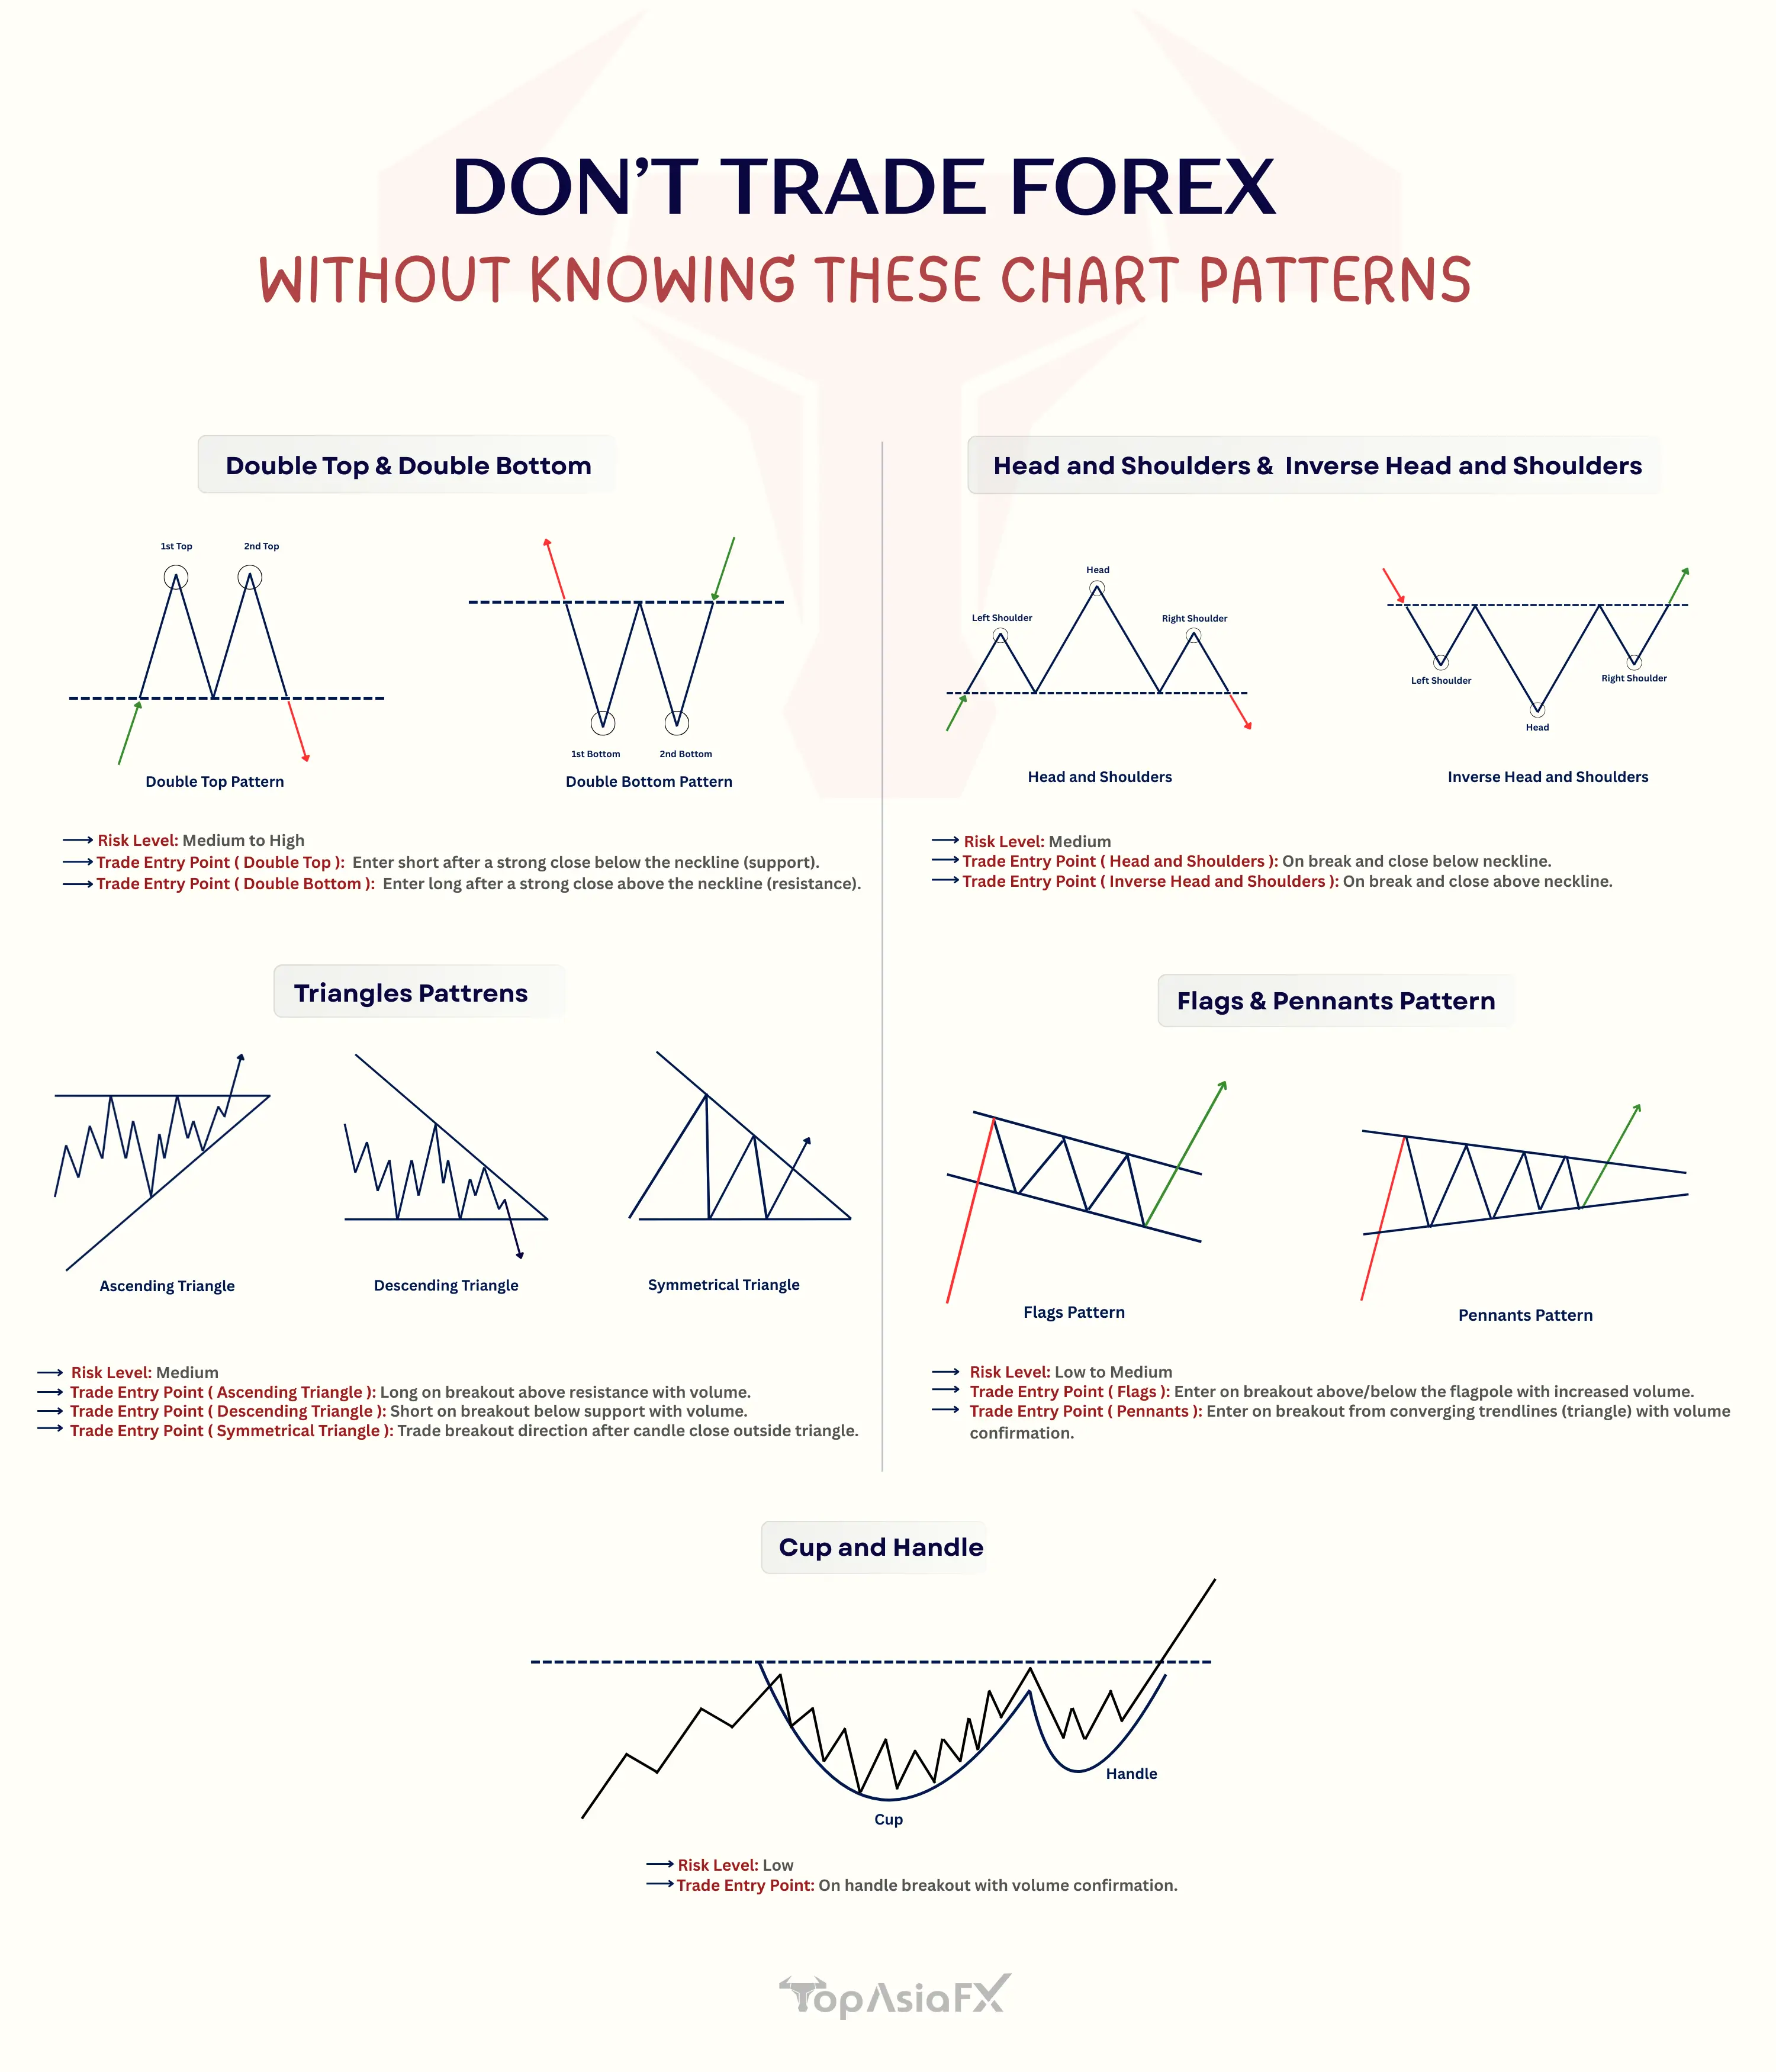
Double Top and Double Bottom
A double top looks like an “M” shape, and it signals a bearish reversal after an uptrend.
Meanwhile, the double bottom looks like a “W”, and signals a bullish reversal after a downtrend.
Entry is often triggered once the price breaks the neckline.
Head and Shoulders (and Its Inverse Pattern)
This indicates exhaustion in a trend. The pattern includes a central peak (head) with two smaller peaks (shoulders).
On the other hand, inverse head and shoulders appear at the bottom of a downtrend and signal a bullish reversal.
Triangle Patterns
A symmetrical triangle hints at a neutral pattern, which means that the breakout can go either way.
An ascending triangle is notorious for a bullish bias. Its reverse twin, the descending triangle reflects the bearish bias.
These triangles are great for identifying breakout patterns and setting targets with precision.
Flags and Pennants
A flag is a small parallel channel that forms after a sharp price move, while a pennant is a tiny symmetrical triangle after a strong trend. Both patterns signal a continuation, especially in swing trading.
Cup and Handle
The cup and handle demonstrate a long-term bullish pattern.
The “cup” forms a rounded bottom; the “handle” shows a brief consolidation before a breakout.
Identify Candlestick Pattern Trading
Think of candlesticks as the market’s body language.
While chart patterns give you structure, candlestick formations add emotional depth, like fear, greed, indecision, and momentum. It’s all there if you know how to read it.
Some classic setups to know with this pattern trading:
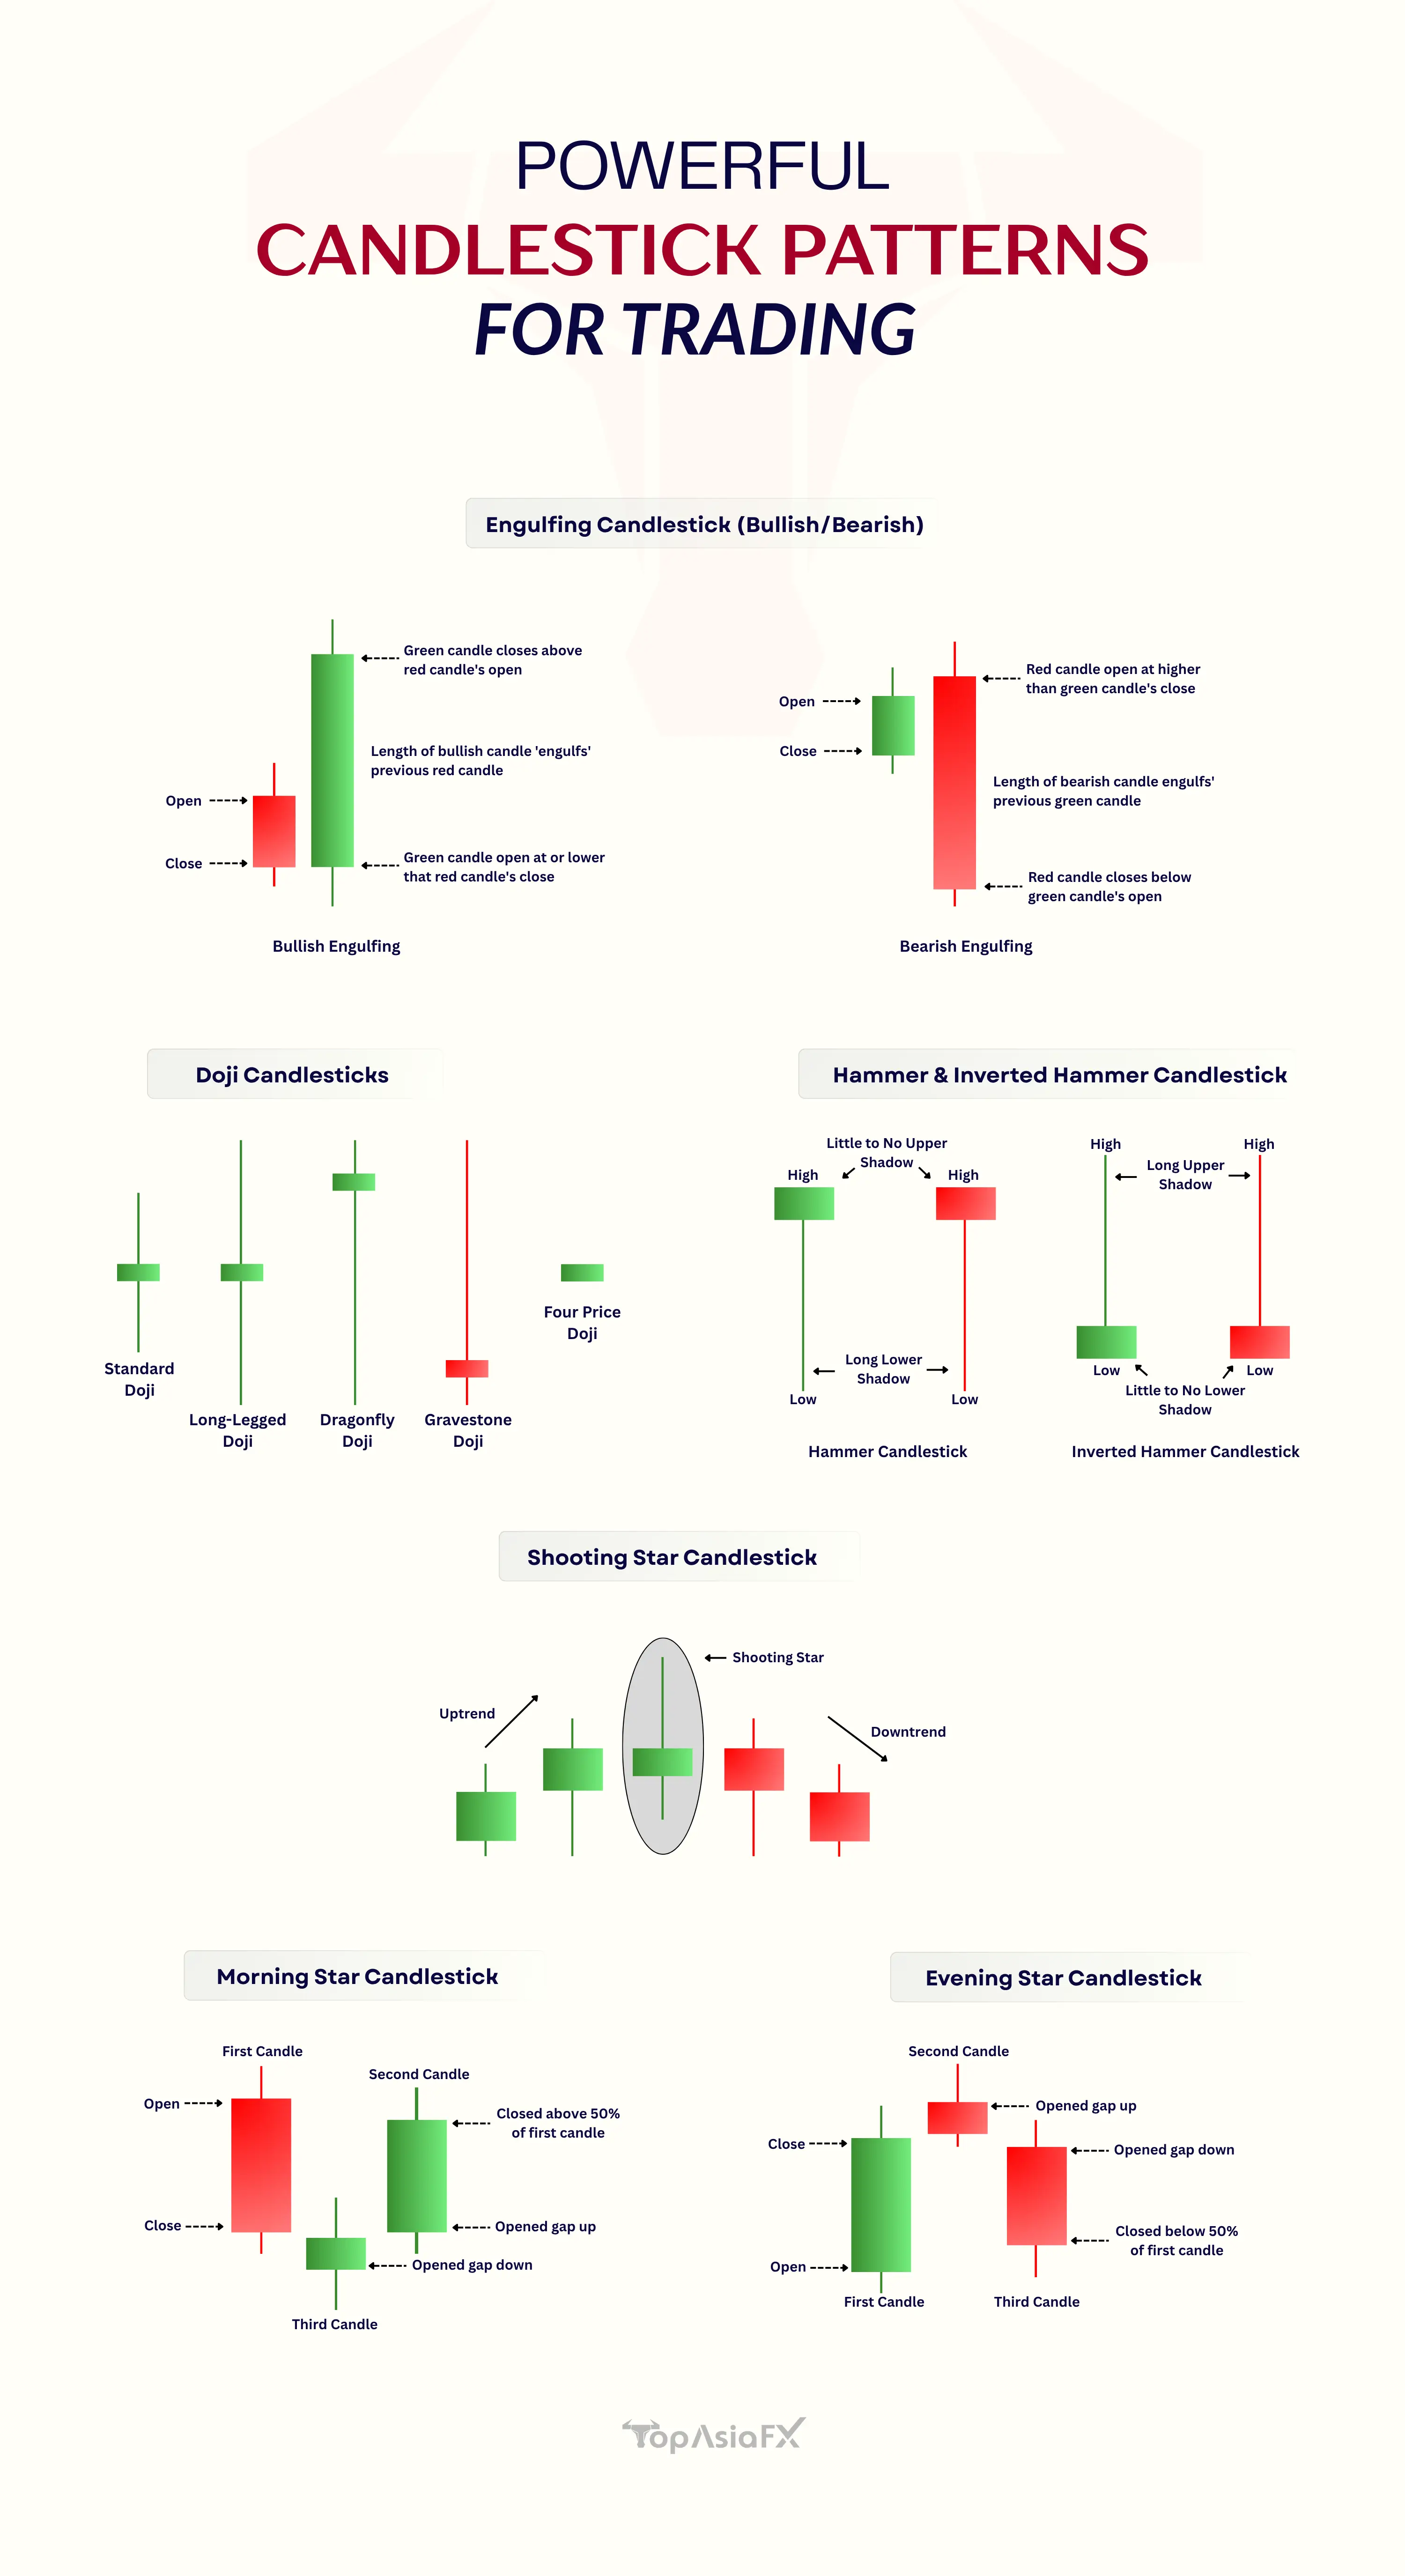
Engulfing Candle (Bullish/Bearish)
This is a strong sign that momentum is shifting. If there’s a bullish engulfing, it means buyers just took over. If it is bearish? Sellers mean business.
Doji
Doji is the ultimate “I’m not sure yet” signal. It means the market is undecided, so stay alert.
Hammer and Shooting Star
These are rejection candles. When there’s a hammer at support, it means buyers pushed back hard. If there’s a shooting star at resistance? Sellers slammed their brakes.
Morning and Evening Stars
These are three-candle reversals that say, “A trend change is brewing”.
Don't use these patterns in isolation. Use them to confirm what your chart is already telling you.
For instance, if you spot a double bottom on GBP/USD? Wait for a bullish engulfing candle to form at the second bottom, as it is a green light for entry.
Market Structure and Trend Analysis
Before you get lost in the candles, zoom out and recognize the bigger patterns.
Market structure is like the skeleton of price movement sht. It shows you where the market has been, and where it might be going.
Here’s how to break it down:
- Start with the higher timeframes (Daily/4H). You’re looking for the overall trend.
- Ask yourself questions like: Are we making higher highs and higher lows (uptrend)? Or lower lows and lower highs (downtrend)?
- Zoom into lower timeframes (1H/15min). This is where you fine-tune your entries. But don’t let the noise confuse you. Stay in sync with the bigger picture. Follow the bigger pattern.
- Draw trendlines. Use them to define channels. Is the price bouncing within a rising wedge? Falling wedge? Or a Triangle? This gives your trade a boundary.
- Mark key levels. Support, resistance, and previous highs/lows are like hotspots where the price often reacts.
- Watch those psychological levels, like 1.1000, 1.2000, because big, round numbers tend to attract attention.
- Don’t ignore Fibonacci retracement zones. They highlight potential pullback areas, especially 61.8% and 50%.
This is where understanding the forex market structure gives you clarity.
Learn to Confirm
Spotting a pattern is the easy part. Acting on it too soon? That’s where traders get burned. Confirmation helps you filter out false moves and trade with confidence.
Here’s how to confirm a setup:
- A break of a key level (neckline, trendline) means the market has made a decision.
- A strong breakout candle (with volume) shows that the move has weight behind it.
- A retest of structure simply means that a price breaks out, and comes back to “test” the level it just left. This is your chance.
- For candlestick signals at the retest, look for hammers, engulfing candles, or pin bars that ideally say “go”.
- Without confirmation, you’re gambling. Learn to confirm before leaping.
Learn More About Trading with Patterns
Confirmation is the first step of trading with patterns, after you are able to recognize them. There are other things to consider, like:
- Determine Entry Points: Enter a trade immediately after the breakout, or wait for a retest of the broken level for a potentially safer entry.
- Set Stop-Loss Orders: Always place a stop-loss just beyond a significant and logical point within the pattern to manage your risk.
- Determine Take-Profit Targets: Calculate measured move targets based on the pattern's dimensions, aligning them with strong support/resistance levels.
- Consider Confluence and Context: Combine pattern signals with other indicators and multiple timeframes for stronger confirmation and a holistic view.
- Practice and Backtesting: Utilize a demo account and backtest historical data to refine your strategy and build confidence.
Here’s a Practical Example to Make It Stick
Let’s say you’re eyeing EUR/USD and you spot a symmetrical triangle forming, and it is squeezing tighter. What to do next?
Here’s your step-by-step:
- Identify the Pattern: Draw your trendlines; one sloping down, one up, meeting at the triangle’s apex.
- Wait for the Breakout: Don’t predict the direction. Let price show its hand.
- Confirm the Move: Look for a strong candle breaking out with increased volume. That’s your green light.
- Enter the Trade: You can either enter at the breakout or wait for a retest of the triangle’s boundary.
- Set Your Stop-Loss: Set it just outside the opposite side of the triangle. It will protect you if the price drops.
- Set Your Take-Profit Target: Measure the height of the triangle and project it from the breakout point. That will give you a realistic goal.
Conclusion: Patterns Are the Market’s Language
Learning to identify patterns in forex isn’t just about shapes on a chart, the idea is to understand behavior.
When you recognize a double top or a flag formation, you're seeing fear, greed, hesitation, or momentum play out visually.
The more time you spend with the charts, the more fluent you become in this silent language. Pair it with forex risk management, practice in demo accounts, and you’ll see improvement in your strategies.
F. Nathan
Felix Nathan is a professional trader, market analyst, and business development executive with over a decade of experience in the forex and financial markets. Felix specializes in providing actionable market insights, trading strategies, and risk man...